
- Services
- Case Studies
- Technologies
- NextJs development
- Flutter development
- NodeJs development
- ReactJs development
- About
- Contact
- Tools
- Blogs
- FAQ
EN
TH
rick@tillitsdone.com
+66824564755
 Ideas to Reality, Lightning Fast.
Custom Web App Development Services based in Thailand
With 10 years of expertise and 60+ successful projects, our Thai web app team crafts fast, secure, and stable solutions using NextJS, NodeJS, and Flutter.
60
Projects delivered
10
Years of experience
 Delivering digital solutions for unique needs.
 Amazing companies we've been working with


 Digital Products, Uniquely Yours
Development Services
Web app that built for speed, security, and maintainability using industry standard frameworks like NextJS,React,Typescript, Flutter,NodeJs and Go.
 NextJS Development
 ReactJs Development
 NodeJS Backend
 Flutter App Development
 Corporate Website
- Custom Backoffice
 Interactive Web App
 Real-world examples
 Case studies of custom softwares.
Explore case studies from some of our projects. Highlight the challenges, solutions, and outcomes for clients across various industries.
Learn more-
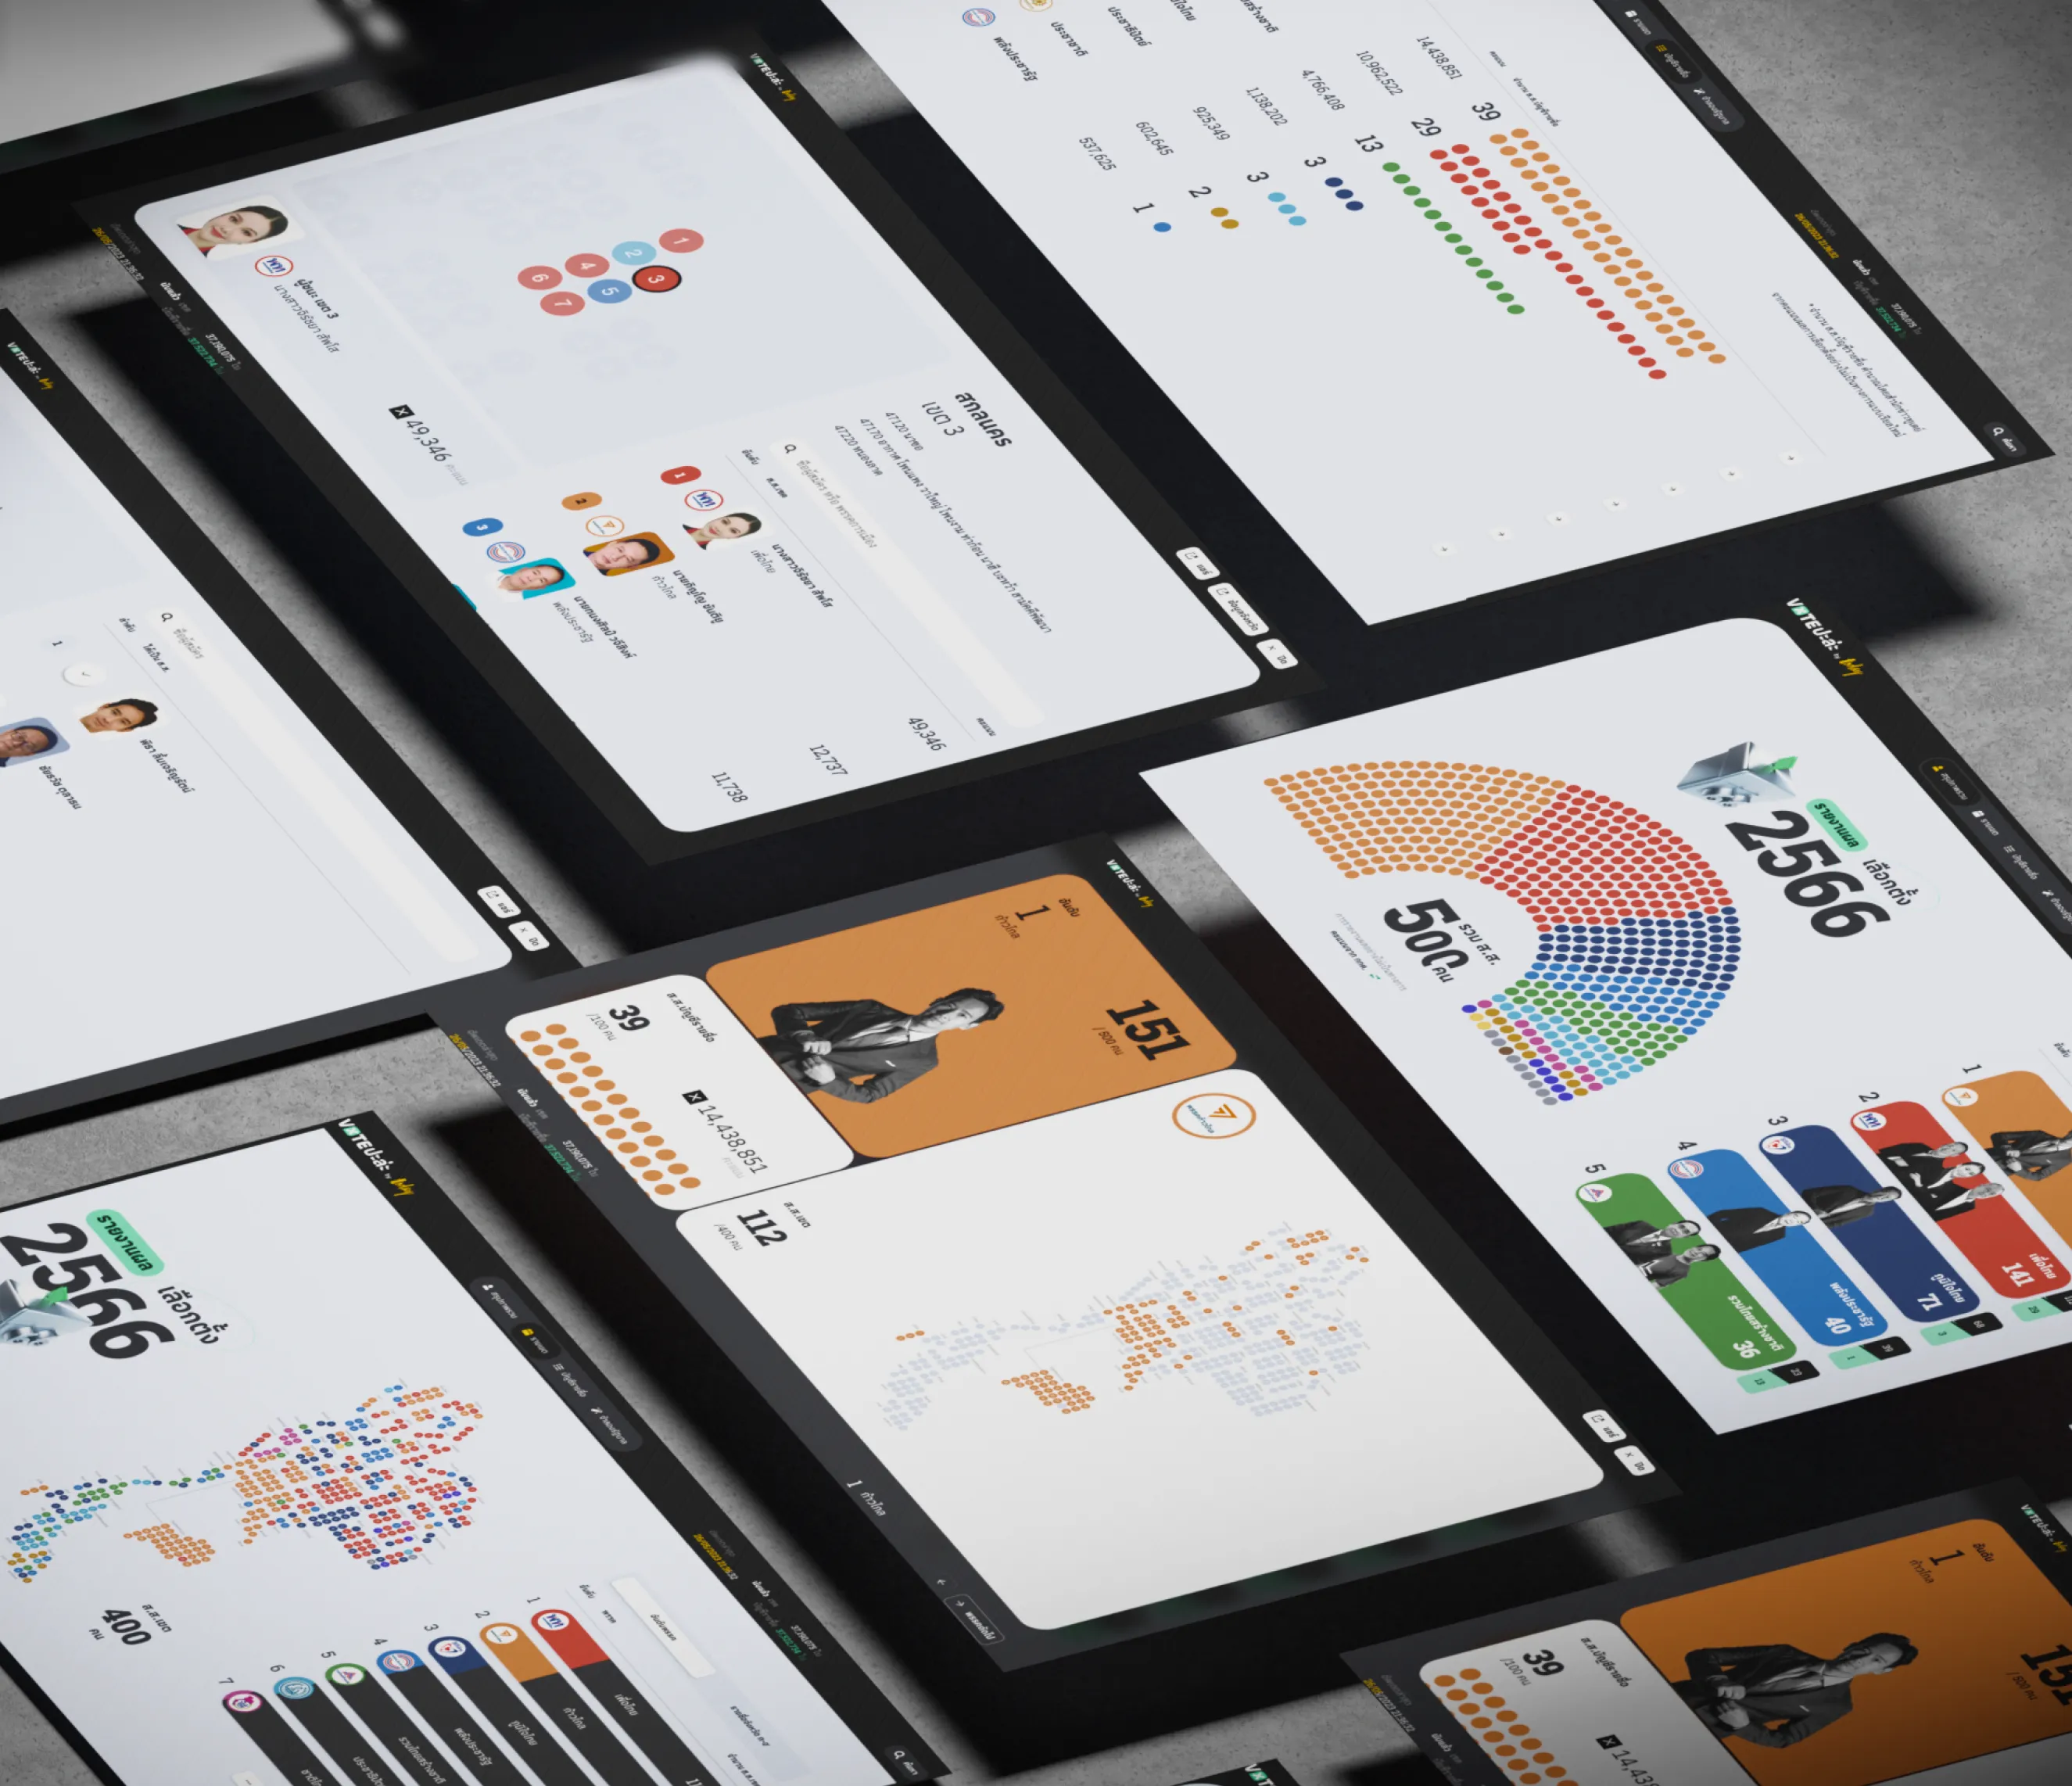
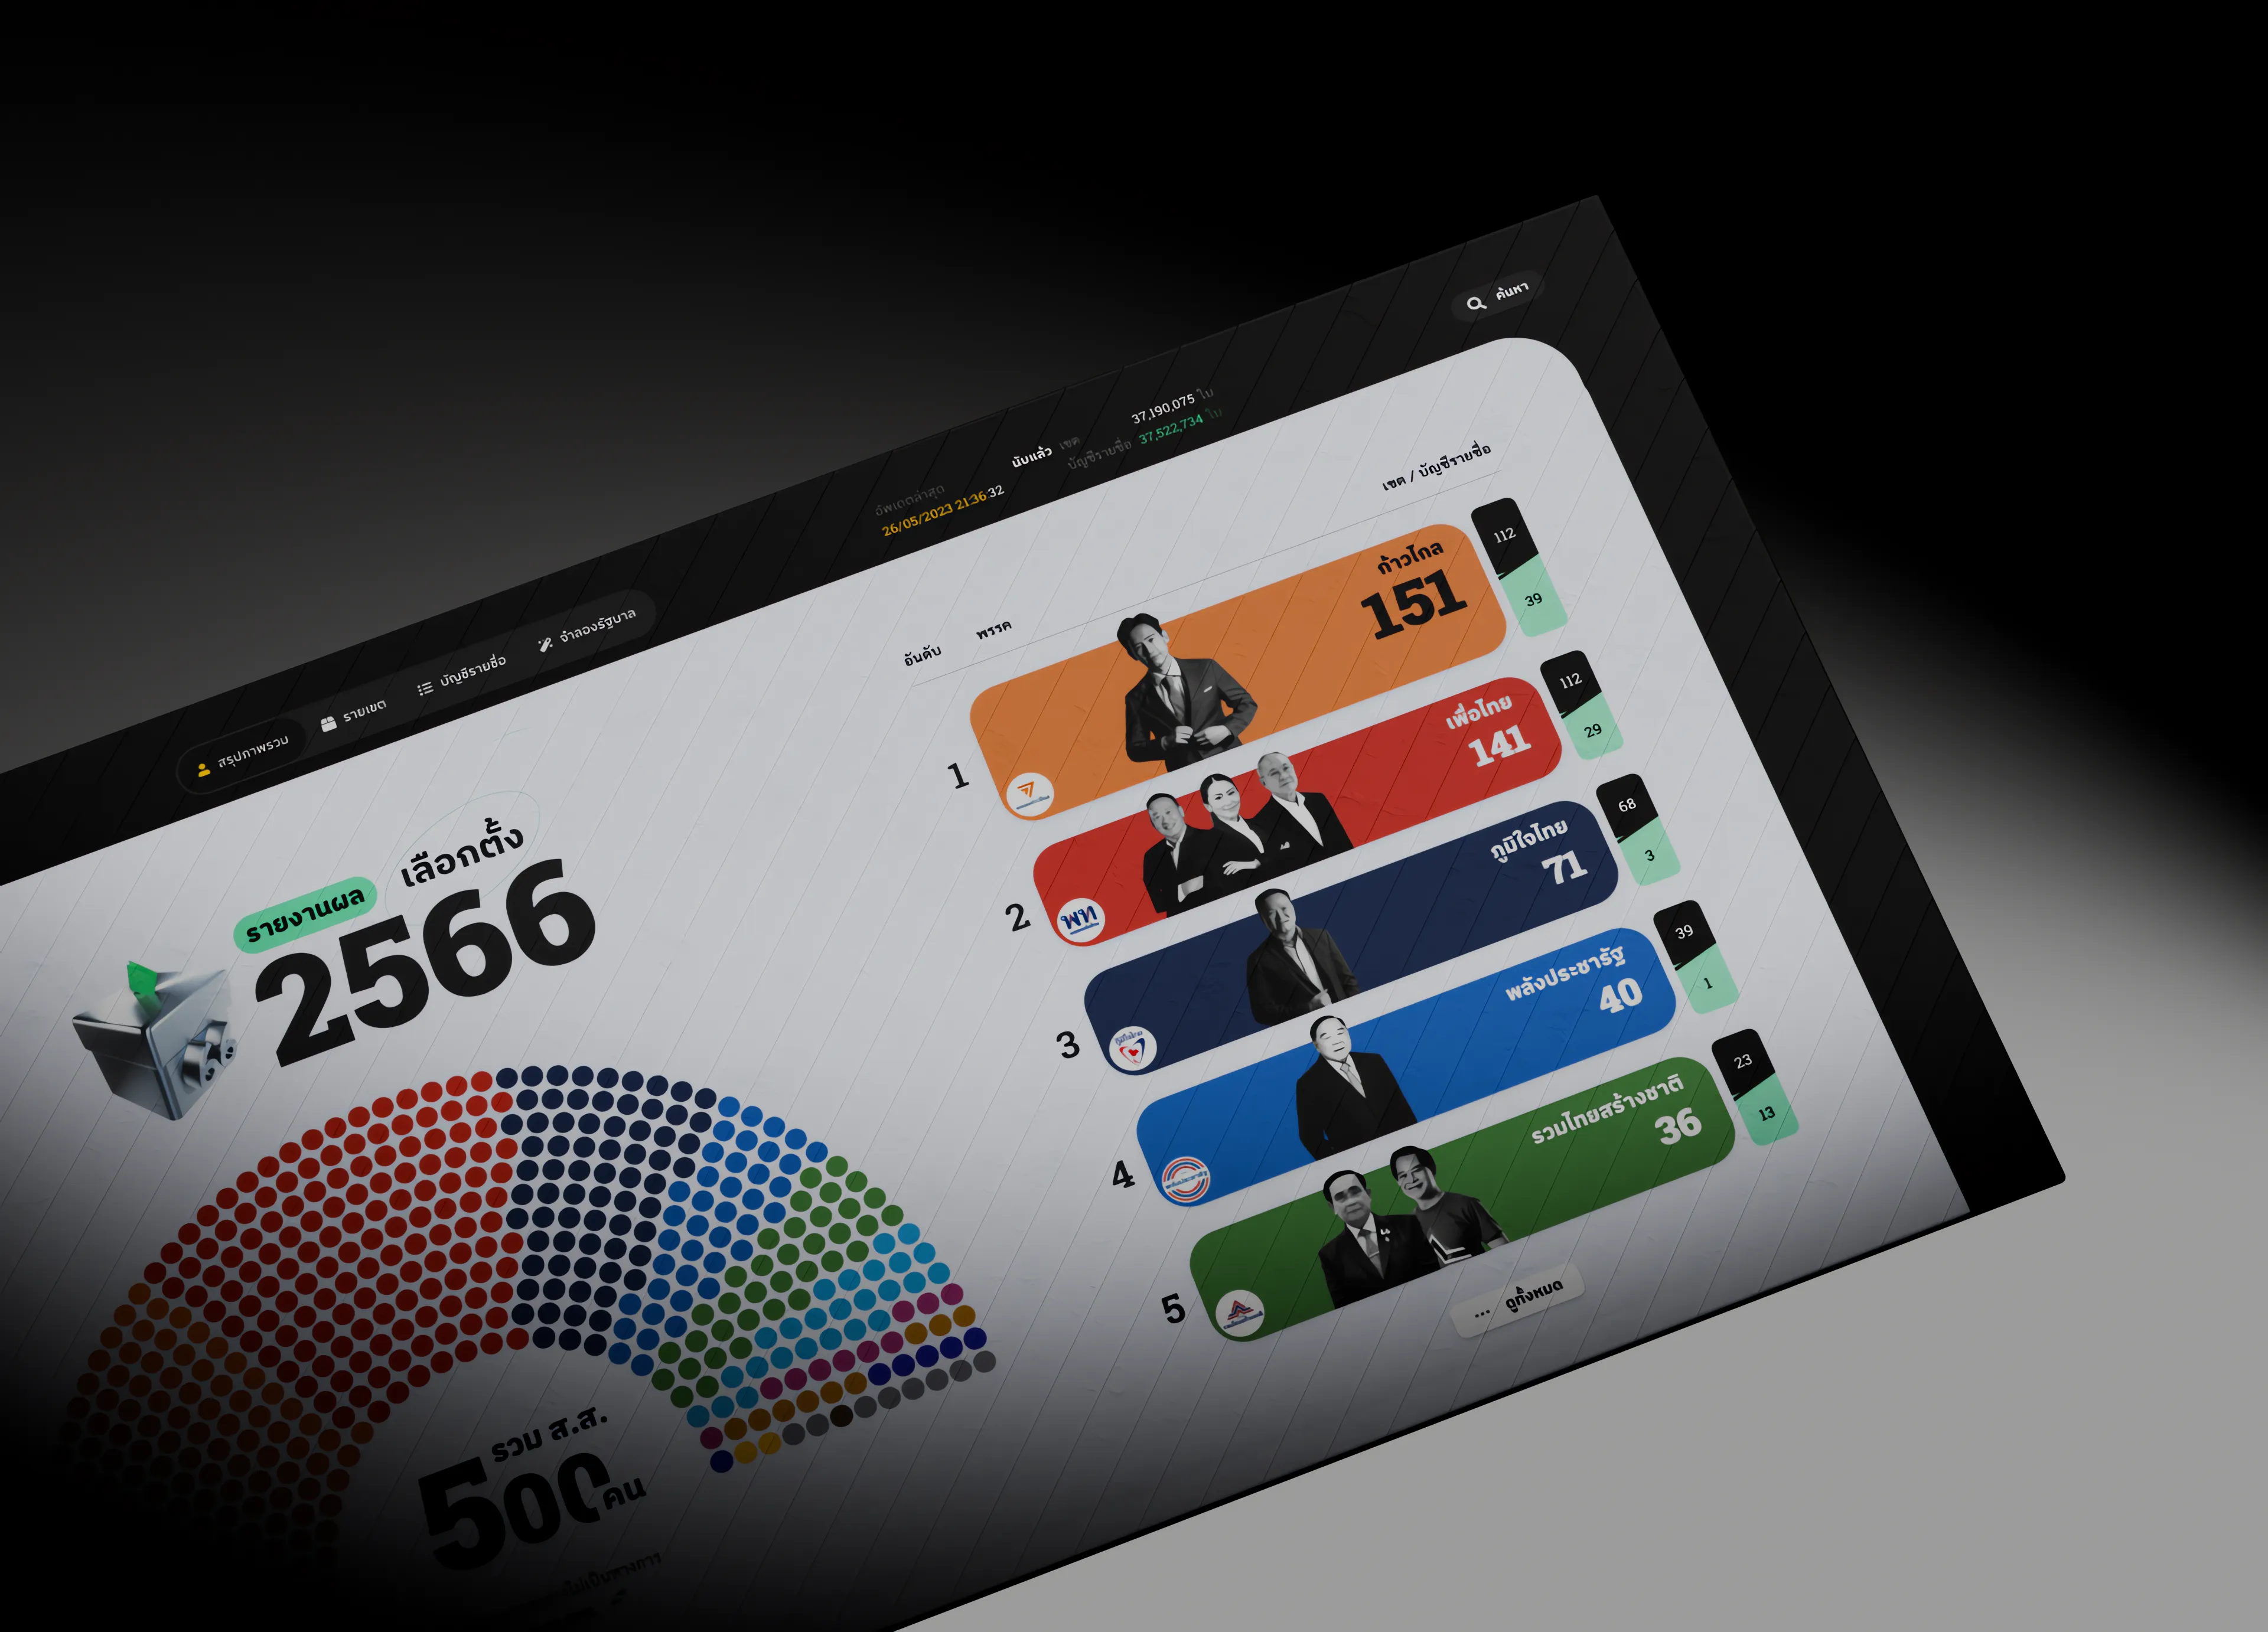 Interactive ReactJs realtime web appTodays - Vote66
 -
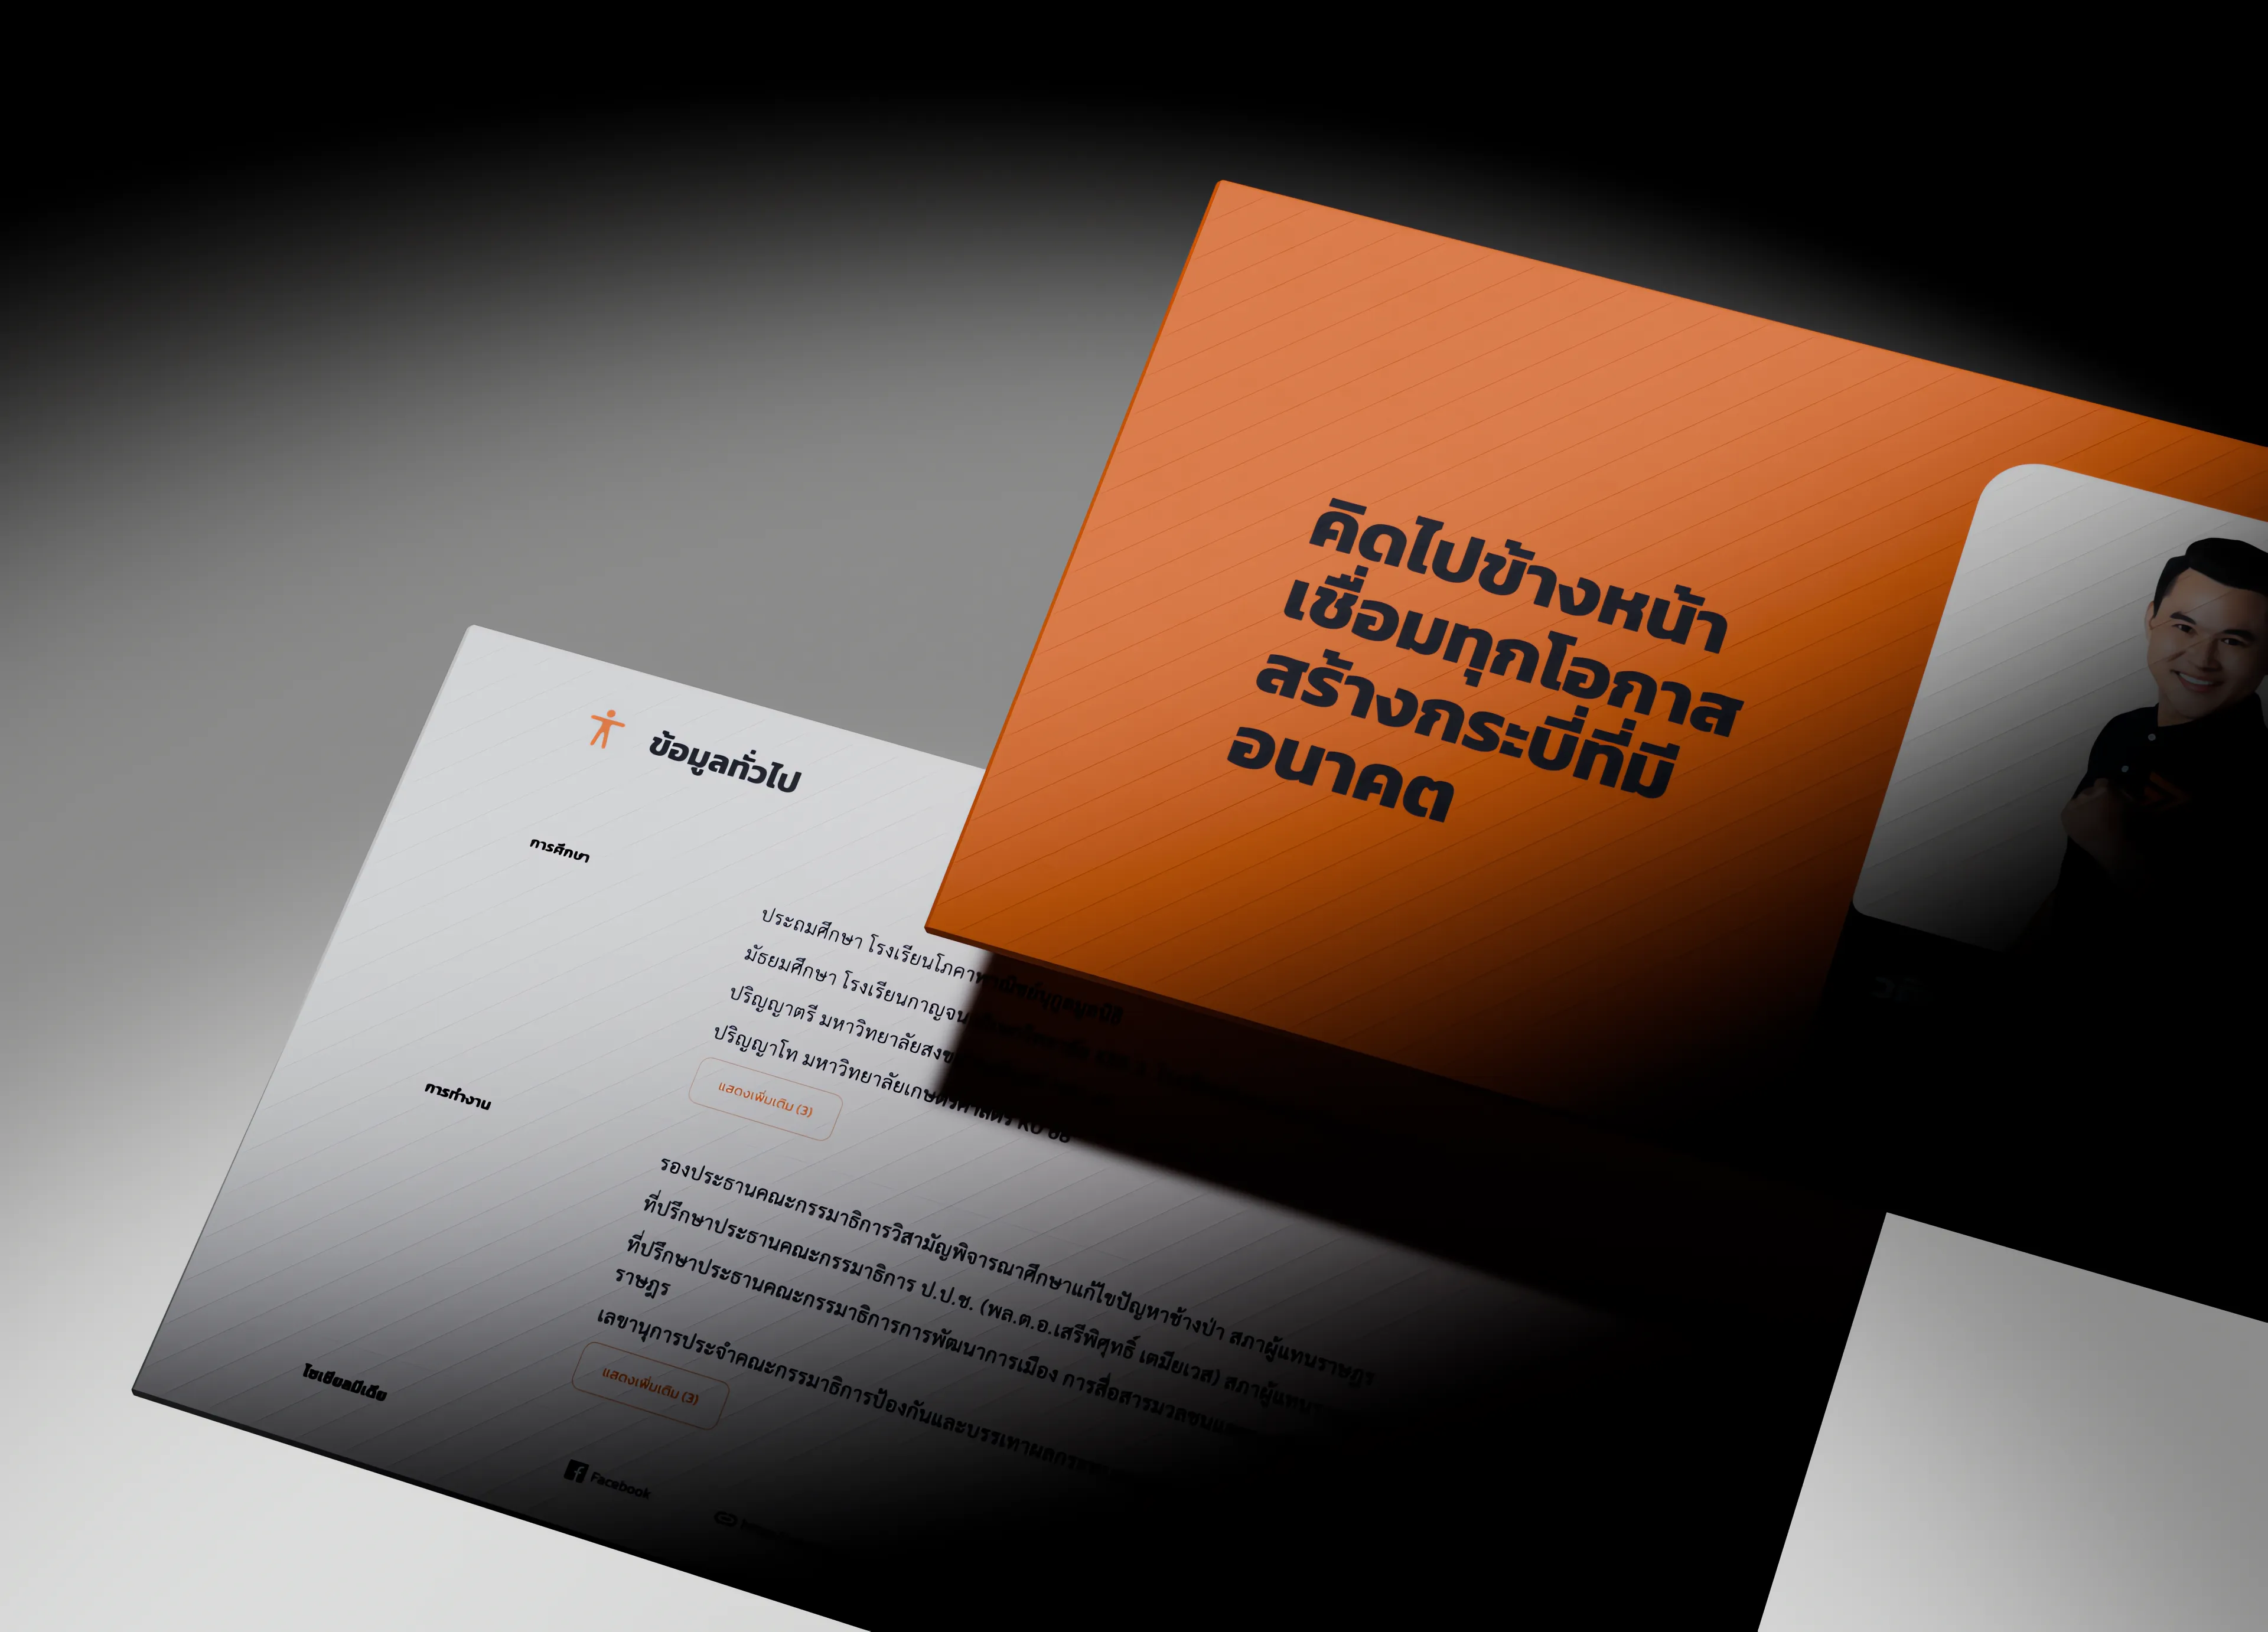 NextJs corporate websiteMFP - party information website
 -
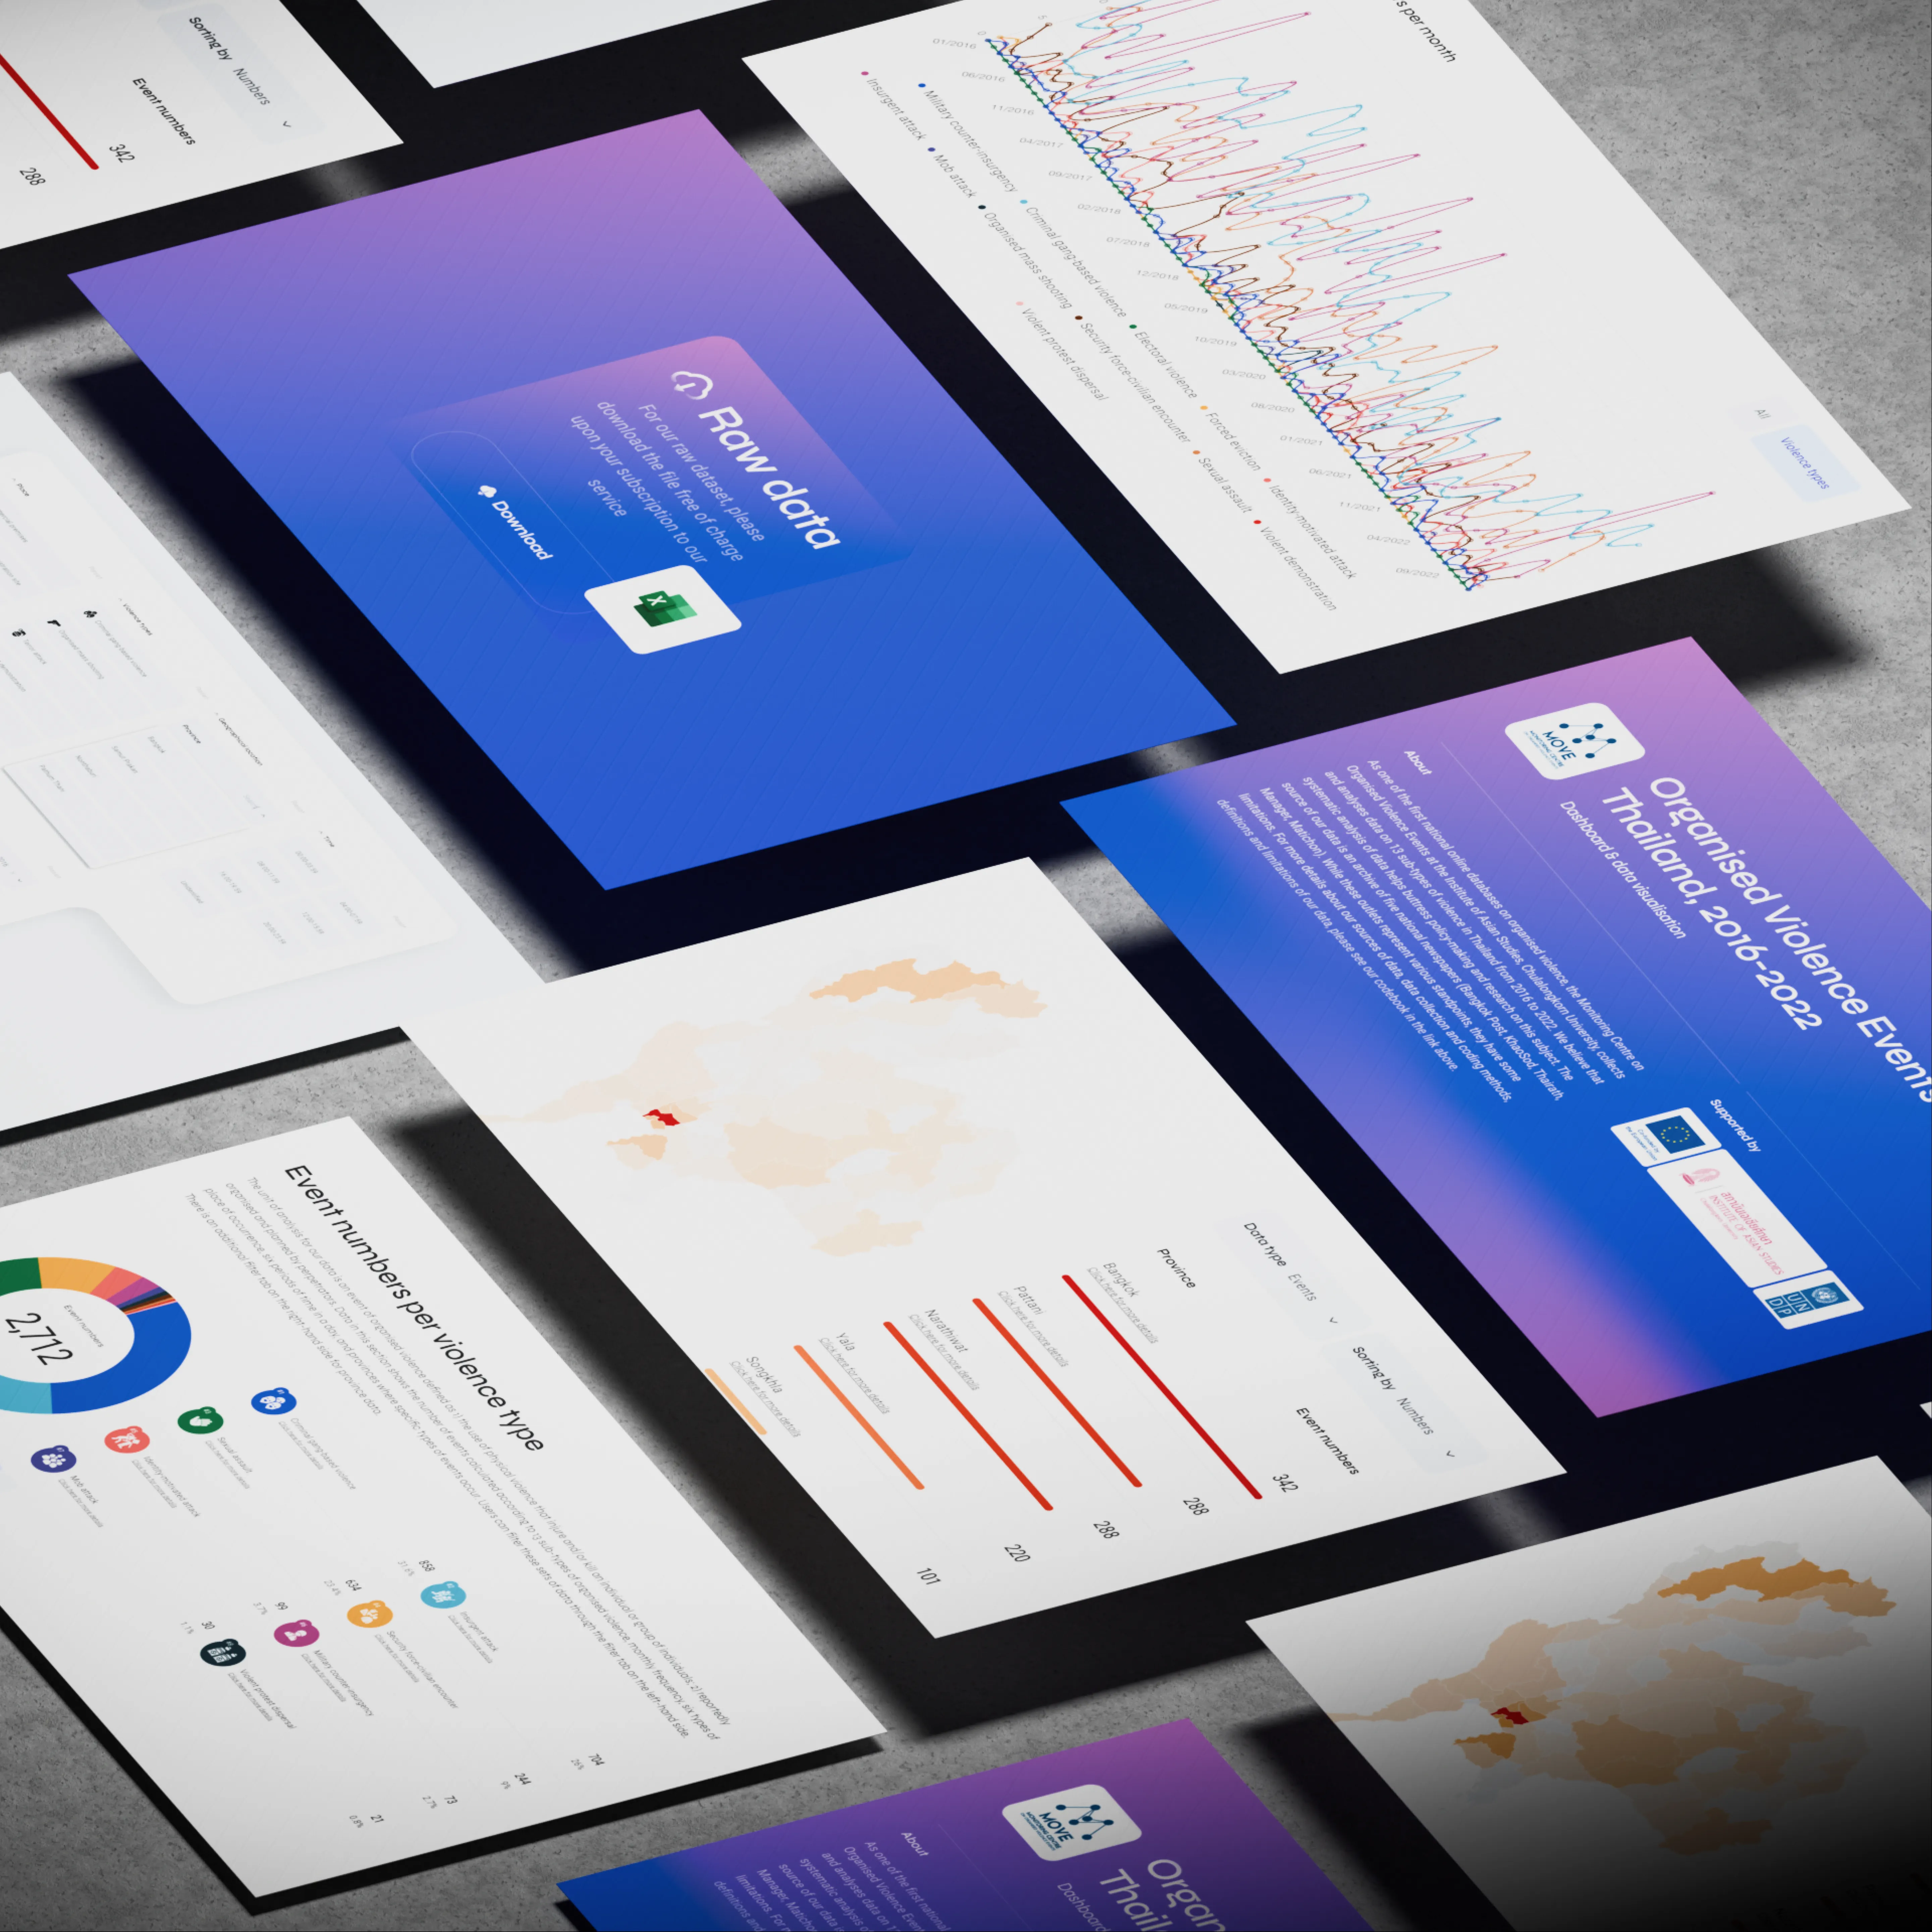
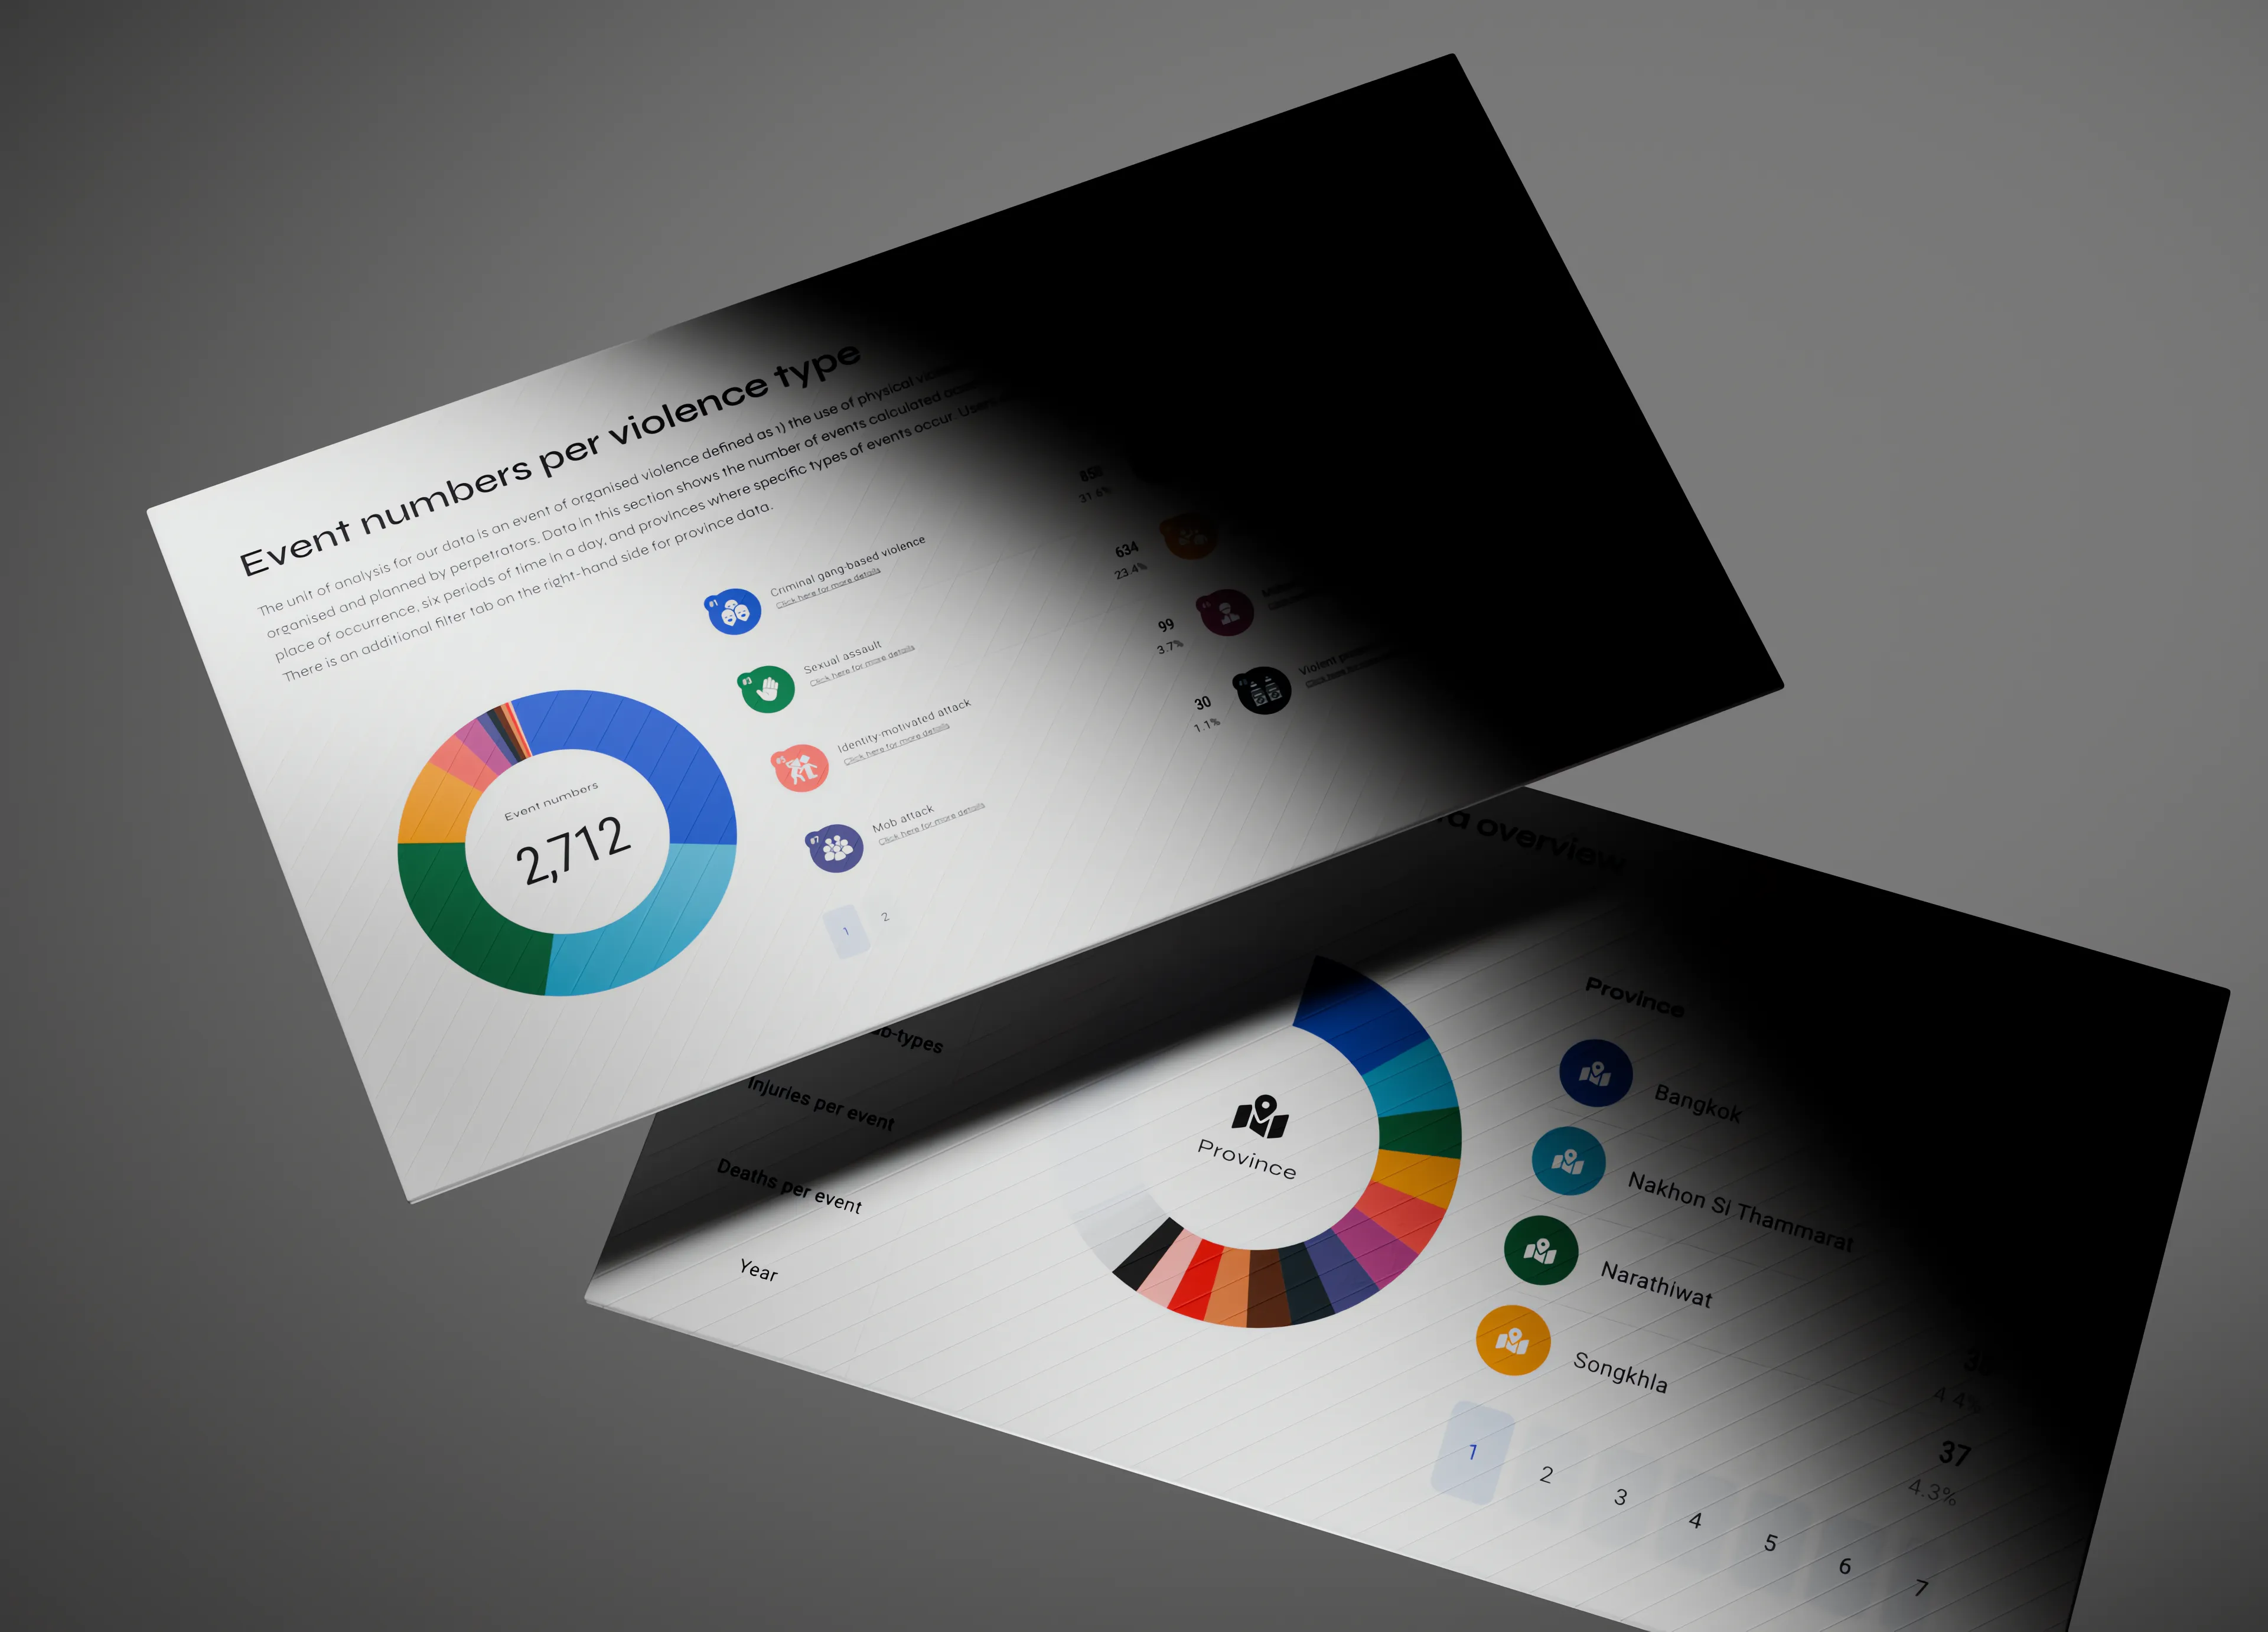 Interactive ReactJs infographic web appMovedata Violence Dashboard
 -
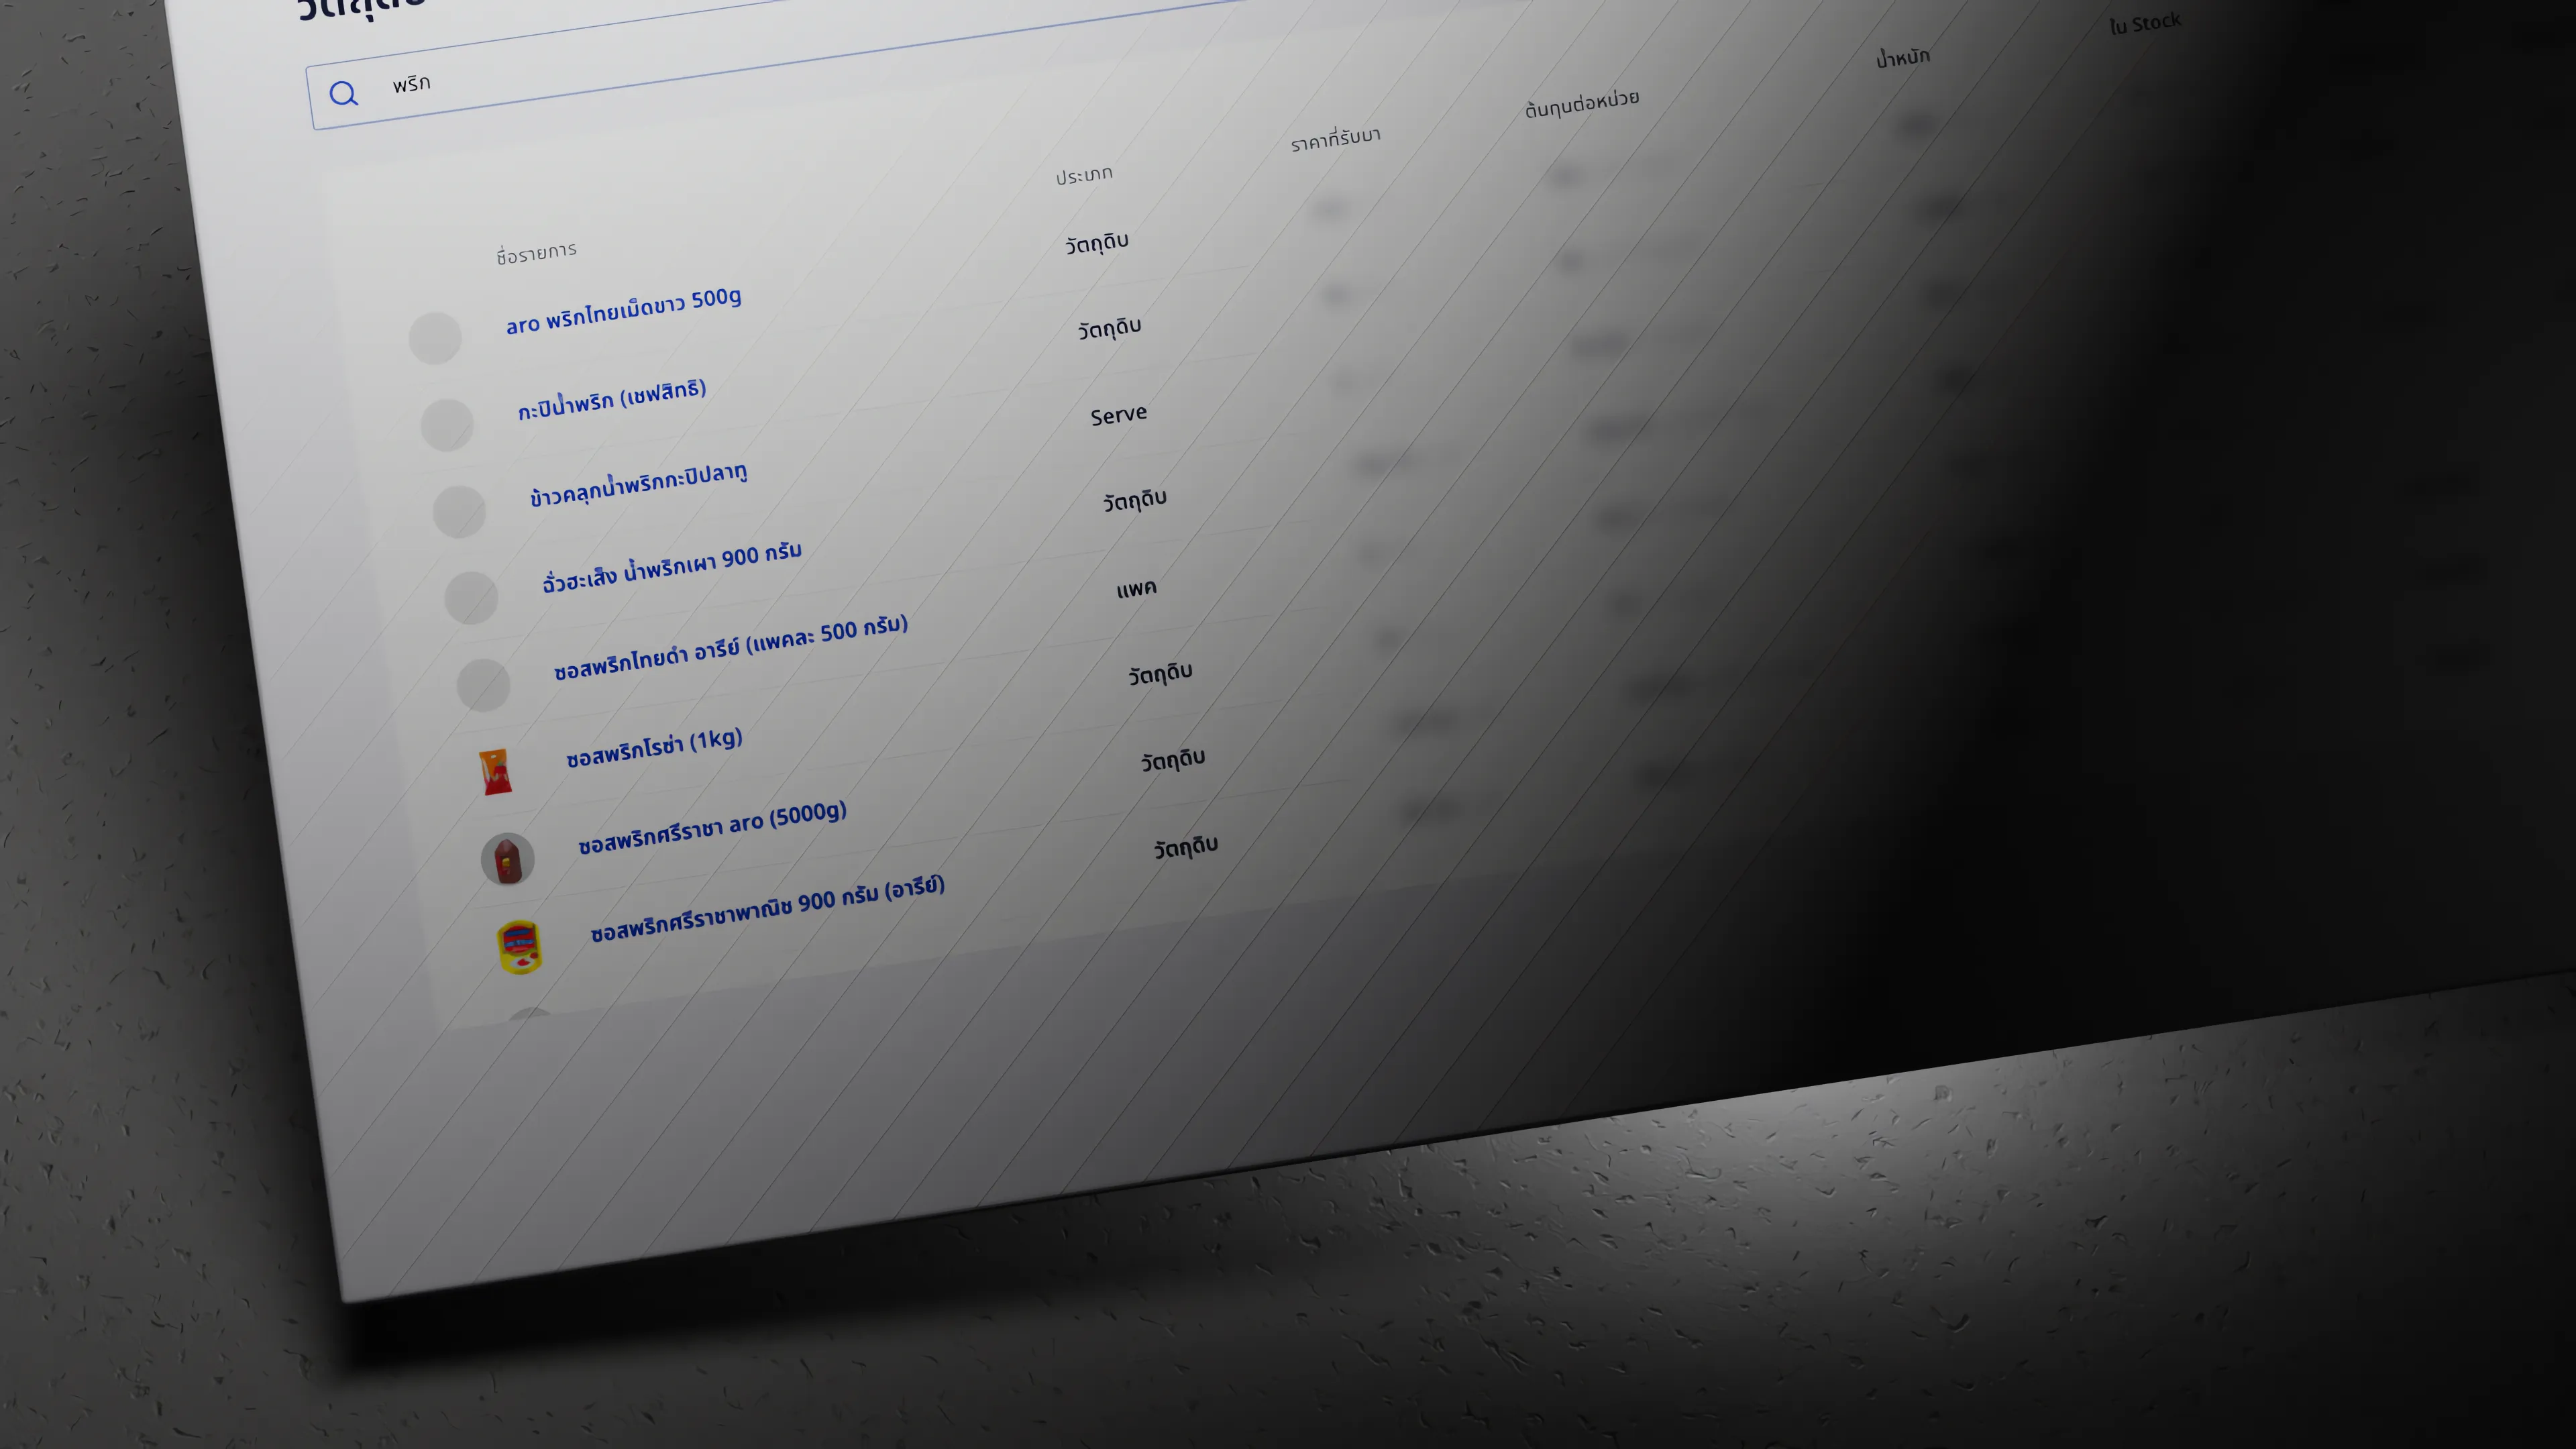 Custom admin backofficeFoodCost Management System
 -
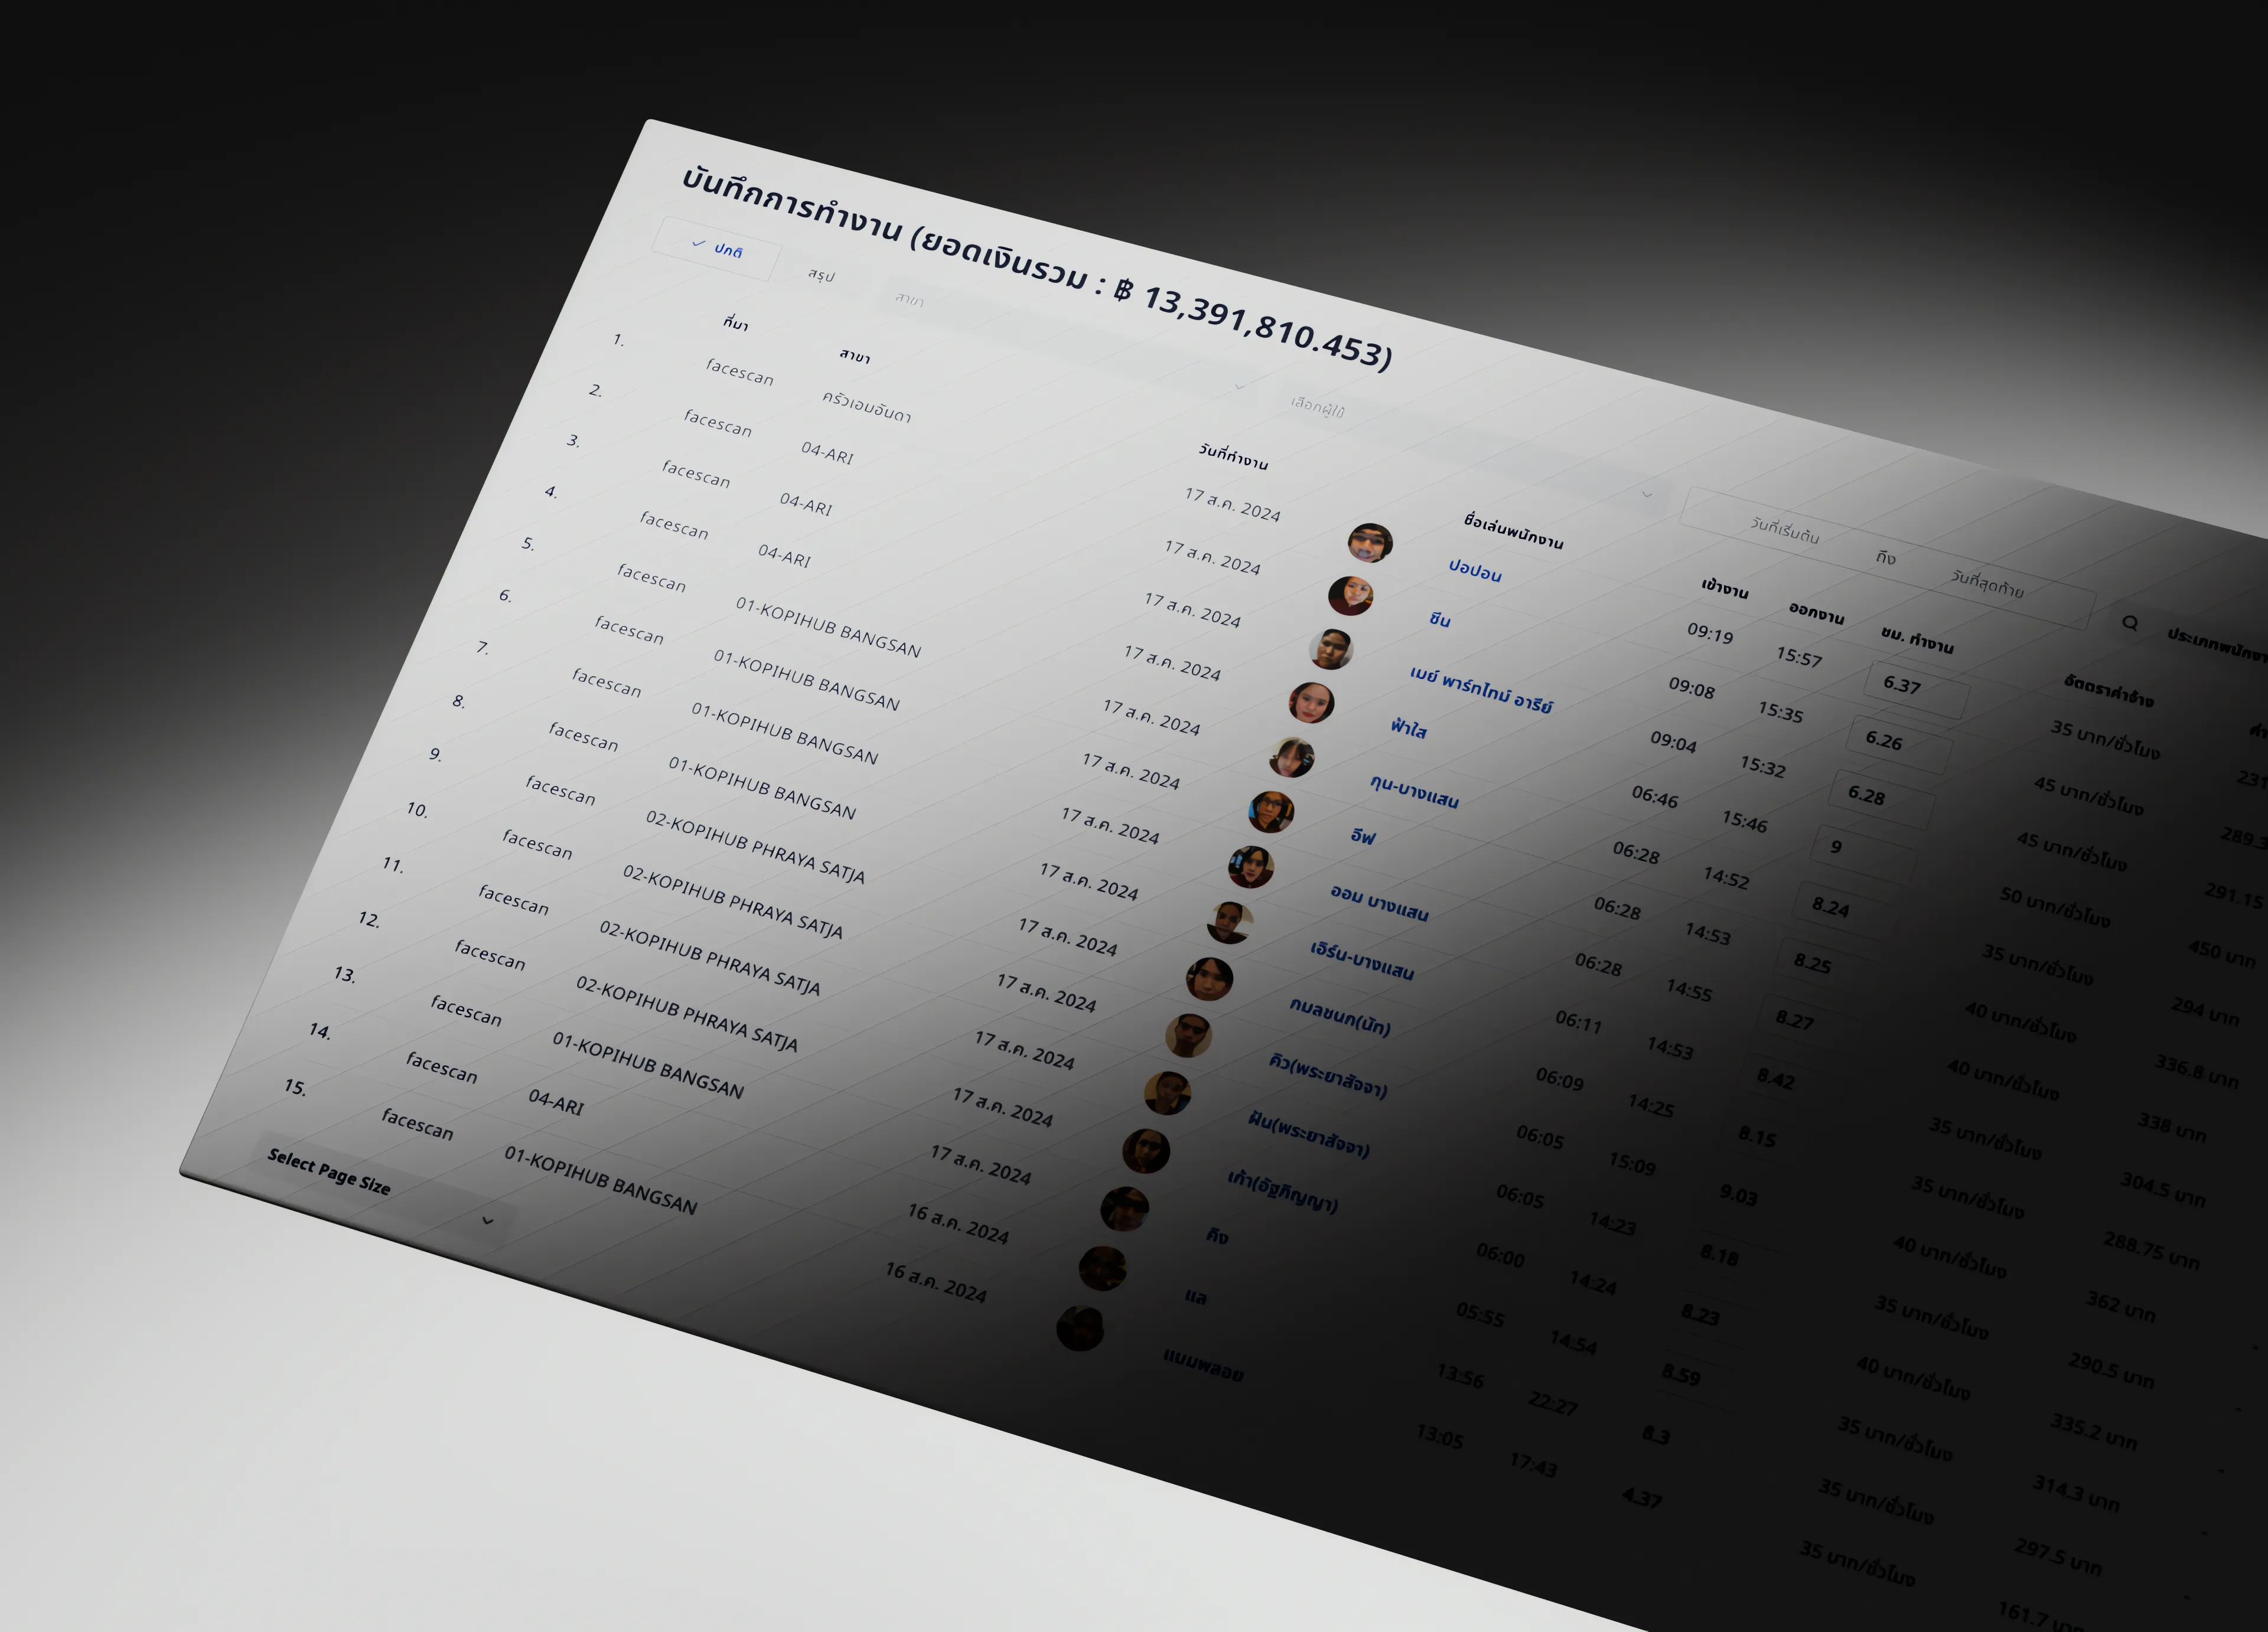 Custom admin backofficeTimeAttendance Management System
 -
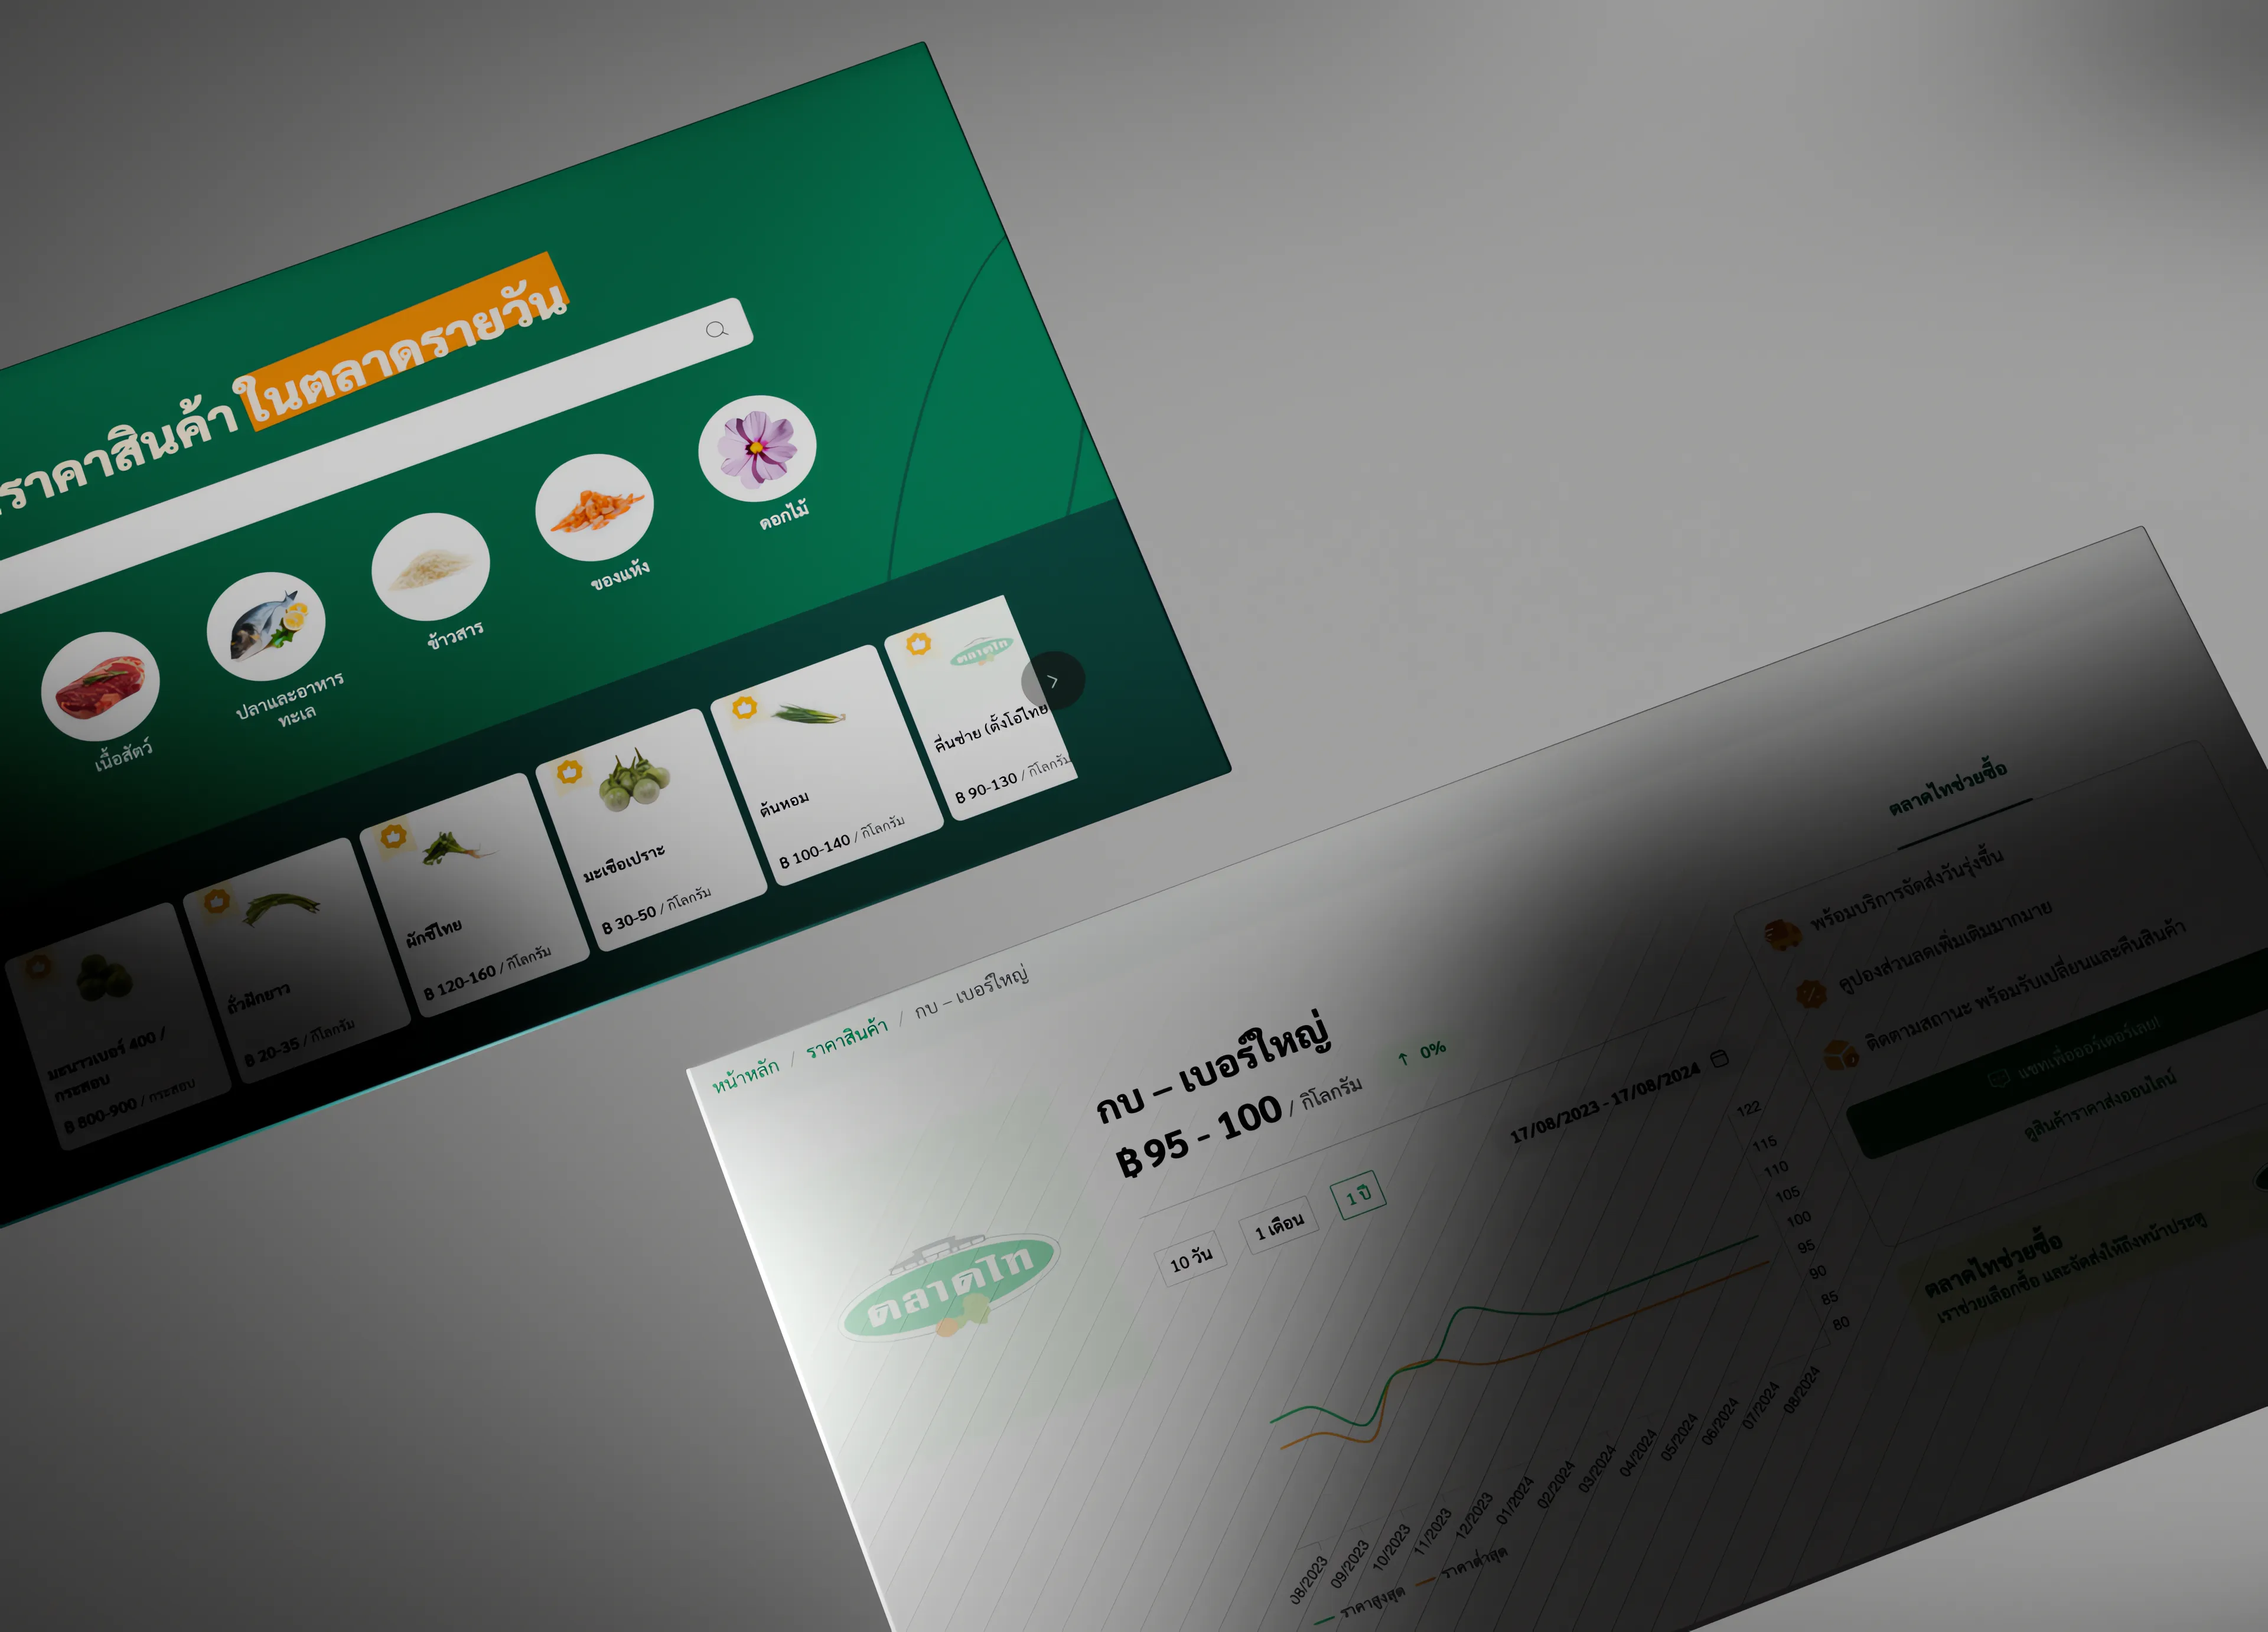 NextJS Corporate websiteTalaadthai Agricultural Marketplace
Our chosen technologies Technologies and tools we use
Leveraging the latest technologies and frameworks, we build robust and scalable solutions that meet your unique business requirements.
Learn more- Web Application FrontendOur carefully selected frontend technology stack is designed to create highly responsive, intuitive, and engaging user interfaces. These technologies work in harmony to enhance the overall user experience, ensuring smooth interactions and optimal performance across various devices and platforms.


-
 BackendOur backend technology stack is designed to handle server-side operations with efficiency, scalability, and security, ensuring reliable and high-performance solutions.
-
 Cross Platform ApplicationOur cross-platform application development leverages advanced frameworks to deliver versatile mobile applications that maintain consistent performance and user experience across various platforms. By utilizing these frameworks, we ensure that applications are highly performant, visually appealing, and reliable, regardless of the platform on which they are deployed.


-
 Cloud ProvidersWe leverage leading cloud platforms to deploy, manage, and scale applications effectively. By utilizing these cloud services, we ensure that our applications perform optimally, are highly available, and can scale according to demand. Our approach involves integrating various cloud tools and services to enhance performance, reliability, and overall efficiency in managing and operating applications.


- IntegrationsOur integration capabilities enable seamless connectivity with a variety of external services and platforms, enhancing the functionality and user experience of our applications. By leveraging these integrations, we provide users with enhanced features and streamlined workflows that connect applications with widely-used tools and services.


-
 Design ToolsWe use a range of design tools to create applications that are both functional and aesthetically pleasing. From collaborative design platforms and digital whiteboards to powerful image editing and 3D creation tools, our design process ensures that every aspect of the user experience is carefully crafted and visually engaging.

Discover our top articles, selected to support the growth of your business.
 สร้างเว็บไซต์ 1 เว็บ ต้องใช้งบเท่าไหร่? เจาะลึกทุกองค์ประกอบ website development cost อยากสร้างเว็บไซต์แต่ไม่มั่นใจในเรื่องของงบประมาณ อ่านสรุปเจาะลึกตั้งแต่ดีไซน์, ฟังก์ชัน และการดูแล พร้อมตัวอย่างงบจริงจาก Till it’s done ที่แผนชัด งบไม่บานปลายแน่นอน
  Next.js สอน 14 ขั้นตอนเบื้องต้น: สร้างโปรเจกต์แรกใน 30 นาที เริ่มต้นกับ Next.js ใน 14 ขั้นตอนเพียงแค่ 30 นาที พร้อม SSR/SSG และ API Routes ด้วยตัวอย่างโค้ดง่าย ๆ อ่านต่อเพื่อสร้างโปรเจ็กต์แรกได้ทันทีที่นี่
  วิธีสมัคร Apple Developer Account เพื่อนำแอปขึ้น App Store ทีละขั้นตอน อยากปล่อยแอปบน App Store ระดับโลก มาอ่านคู่มือสมัคร Apple Developer Account พร้อมเคล็ดลับ TestFlight และวิธีอัปโหลดที่ง่ายในบทความเดียวนี้ได้เลย
  TypeScript Interface คืออะไร? อธิบายพร้อมวิธีใช้และข้อแตกต่างจาก Type เรียนรู้วิธีใช้ TypeScript Interface เพื่อสร้างโครงสร้างข้อมูลที่ปลอดภัยและเข้าใจง่าย พร้อมเปรียบเทียบข้อดีข้อแตกต่างกับ Type ที่คุณต้องรู้ ถูกรวมเอาไว้ในบทความนี้แล้ว
  Material-UI (MUI) คืออะไร อยากสร้าง UI สวยงามและเป็นมืออาชีพในเวลาอันรวดเร็วใช่ไหม มาทำความรู้จักกับ Material-UI (MUI) ที่ช่วยให้คุณพัฒนาแอปพลิเคชันบน React ได้ง่ายและดูดีในทุกอุปกรณ์
  เปรียบเทียบ 3 วิธีติดตั้ง install node js บน Ubuntu: NVM vs NodeSource vs Official Repo แบบไหนดีที่สุด? เรียนรู้วิธีติดตั้ง Node.js บน Ubuntu ด้วย NVM, NodeSource หรือ Official Repo เลือกวิธีที่เหมาะกับความต้องการของคุณ พร้อมเปรียบเทียบ เพื่อการพัฒนาที่มีประสิทธิภาพ!
Our Approach
By choosing Tillitsdone, you are not just hiring a development team, you are partnering with a dedicated and experienced group of professionals committed to your success.
Let us help you bring your vision to life with our expertise, quality, and unwavering support.
Let us help you bring your vision to life with our expertise, quality, and unwavering support.
Parallel development for speed.
We work on multiple parts of your project at the same time, so we can finish faster.
Our team is adept at parallel development, allowing us to work on multiple components of your project simultaneously. This approach significantly reduces development time and ensures timely delivery of your software.
Fast and efficient workflows.
Our streamlined processes help us get your project done fast, without sacrificing quality.
Our streamlined development processes and efficient workflows enable us to deliver projects quickly without compromising on quality. We leverage tools like Docker for consistent environments and Jenkins for continuous integration to accelerate the development cycle.
On-time project delivery.
We know how important deadlines are, and we always make sure to meet them.
We understand the importance of meeting deadlines. Our commitment to punctuality ensures that your project is completed on schedule, enabling you to launch your product and achieve your business objectives without delays.
Clear, open communication
No surprises here! We keep you in the loop 24/7, so you always know what's cooking.
We believe in clear and open communication throughout the project, ensuring you are informed and involved at every stage.
Tailored solutions for you
Every business is unique, and we get that. We'll work with you to create a perfect fit for your needs.
We understand that each business has unique needs. Our team works closely with you to tailor solutions that align with your specific requirements and goals, ensuring that the final product perfectly fits your vision.
Meticulous attention to every detail.
We pay attention to every little detail, making sure everything is just right.
We pride ourselves on our meticulous attention to detail. Every aspect of your project, from user interface design to backend architecture, is carefully crafted to meet the highest standards of excellence.
Complete, end-to-end services.
We take care of everything, from the first meeting to long after your project is live.
From initial consultation and design to development, deployment, and post-launch support, we provide comprehensive services that cover every aspect of your project. You can rely on us for ongoing maintenance, updates, and enhancements.
Always here to help.
We’re here for you every step of the way, from start to finish and beyond.
We are always available to assist you, ensuring that any issues are promptly addressed and that you have the resources and guidance needed to maximize the value of your investment.

Let's keep in Touch
Thank you for your interest in Tillitsdone! Whether you have a question about our services, want to discuss a potential project, or simply want to say hello, we're here and ready to assist you.
We'll be right here with you every step of the way.
We'll be right here with you every step of the way.
Contact Information
rick@tillitsdone.com+66824564755
Address
9 Phahonyothin Rd, Khlong Nueng, Khlong Luang District, Pathum Thani, Bangkok Thailand
Social media
FacebookInstagramLinkedIn
We anticipate your communication and look forward to discussing how we can contribute to your business's success.
We'll be here, prepared to commence this promising collaboration.
We'll be here, prepared to commence this promising collaboration.

Frequently Asked Questions
Explore frequently asked questions about our products and services.
Whether you're curious about features, warranties, or shopping policies, we provide comprehensive answers to assist you.
Whether you're curious about features, warranties, or shopping policies, we provide comprehensive answers to assist you.