
- Services
- Case Studies
- Technologies
- NextJs development
- Flutter development
- NodeJs development
- ReactJs development
- About
- Contact
- Tools
- Blogs
- FAQ
EN
TH
rick@tillitsdone.com
+66824564755
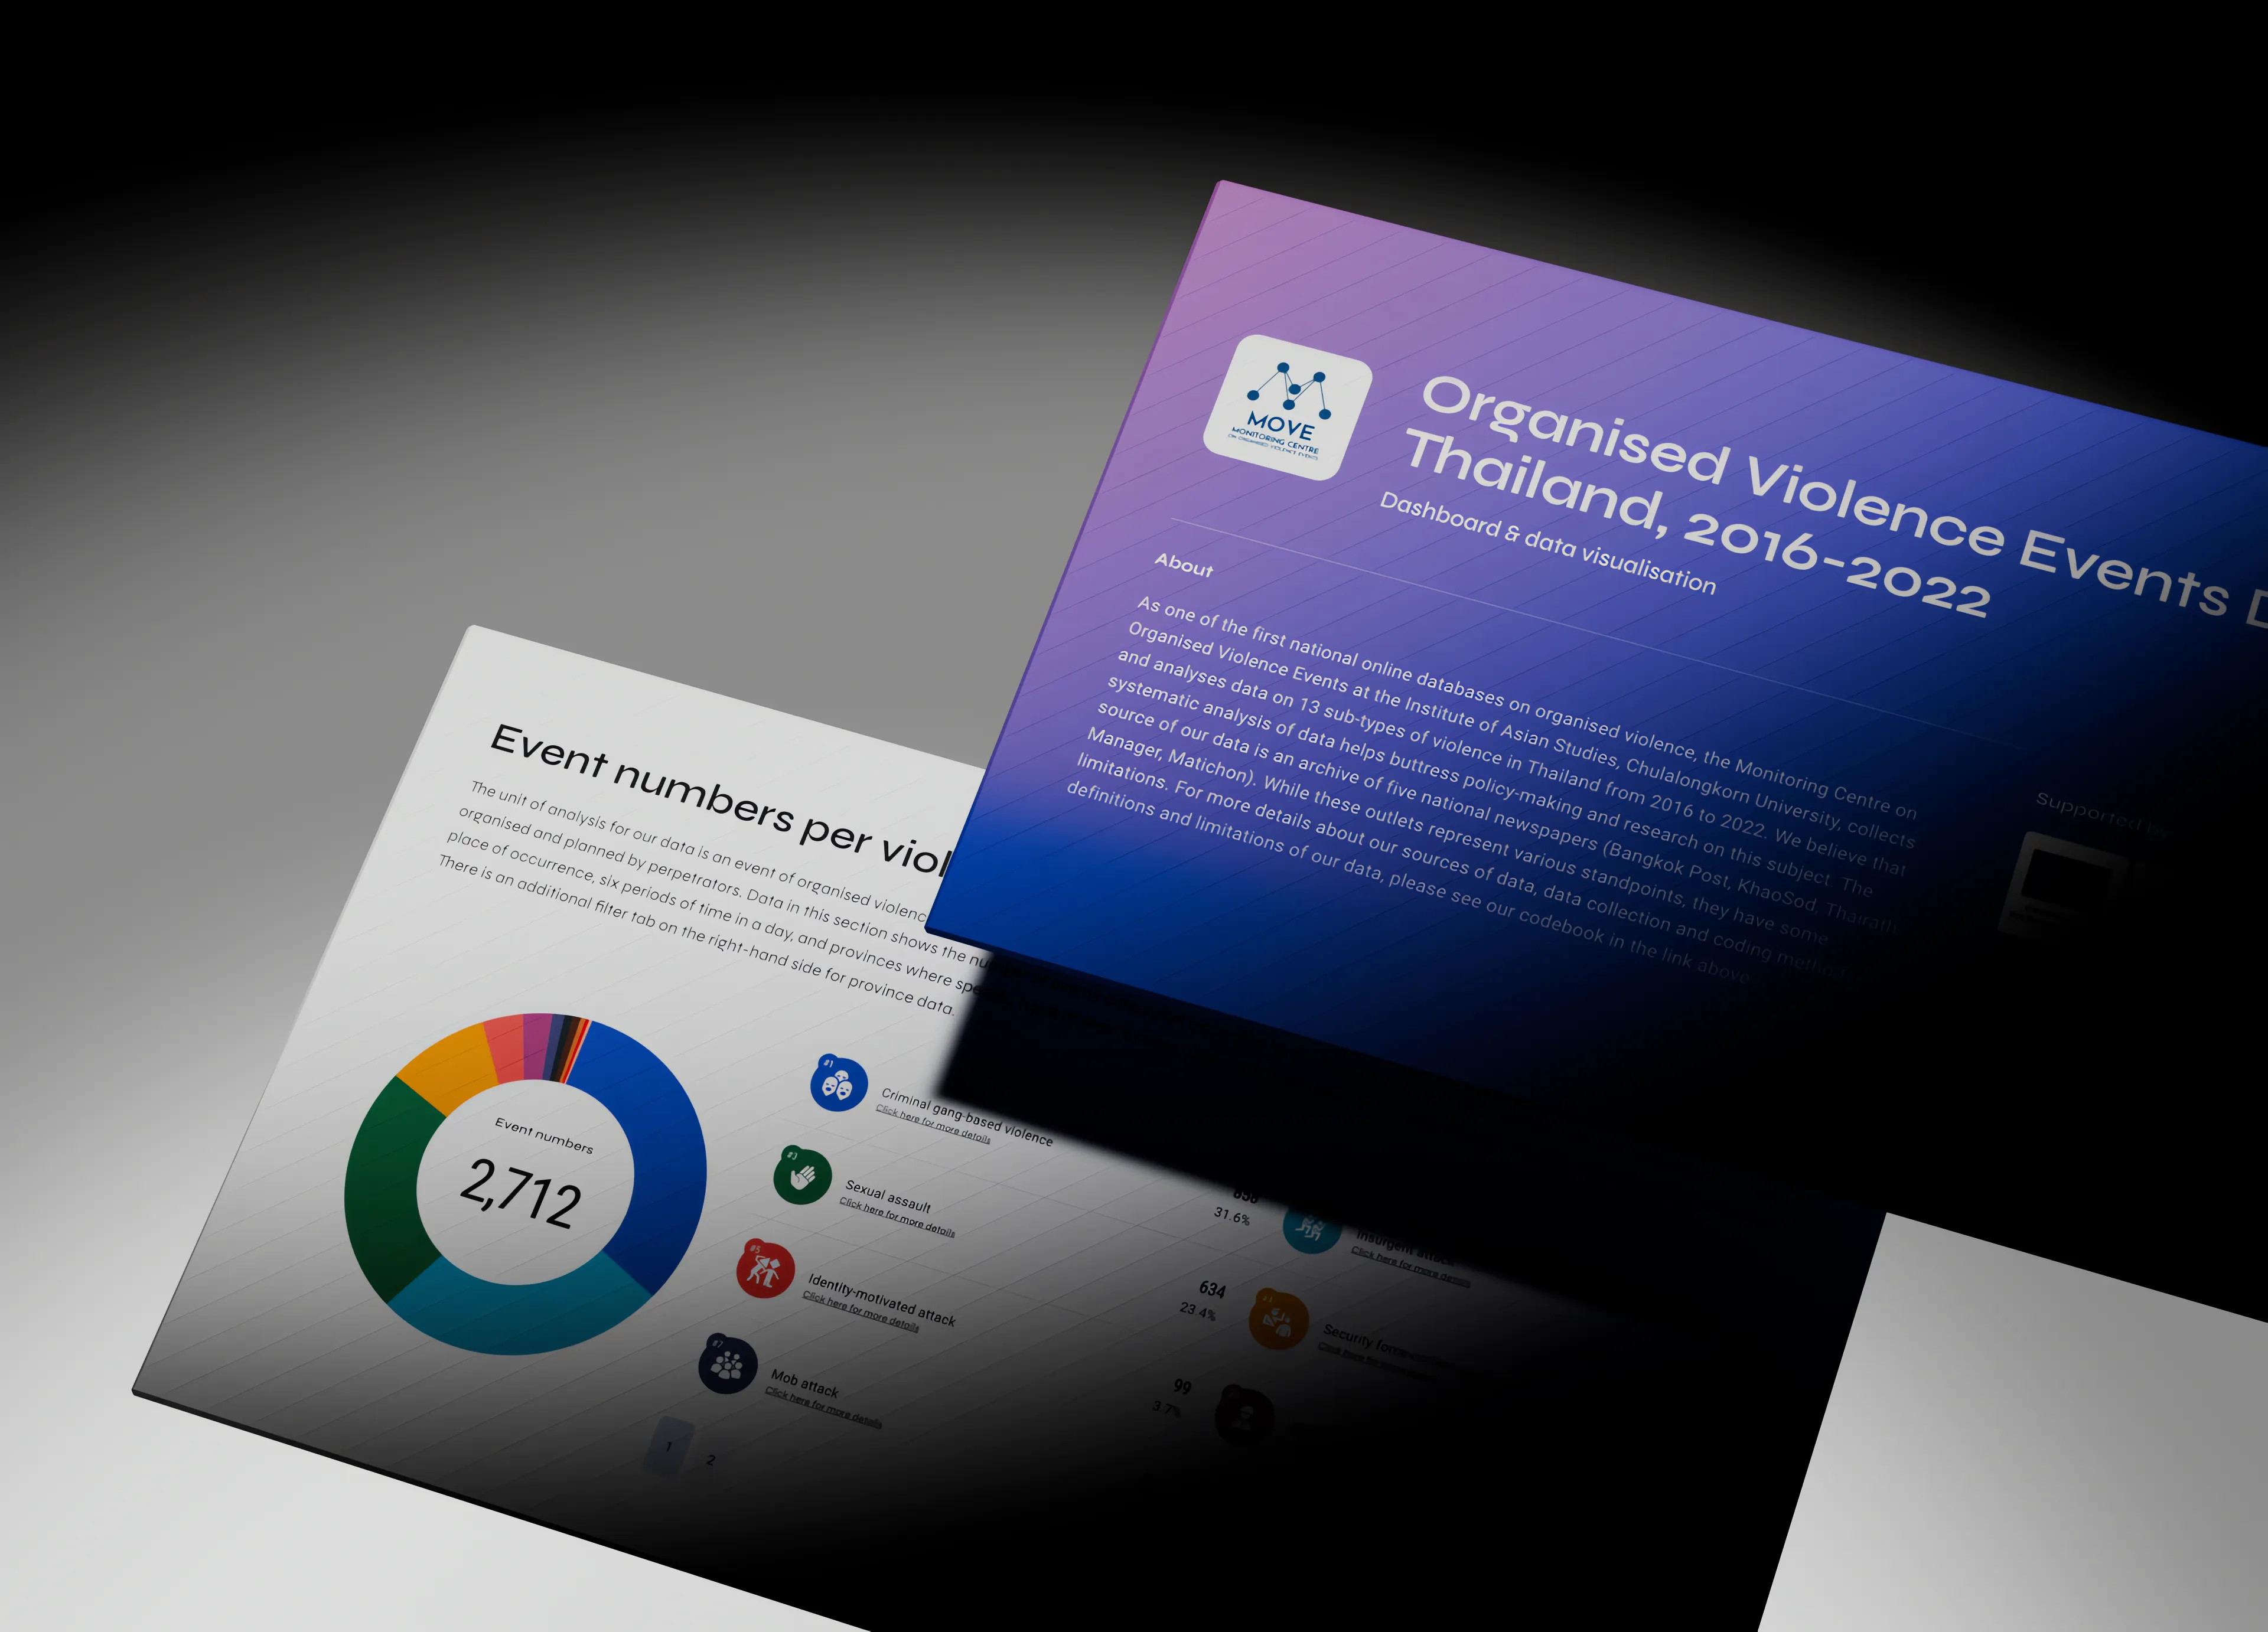
Interactive Violence Data Visualization for UNDP and Chulalongkorn University
Highlights
Interactive violence data visualization
Multi-attribute filtering system
Kobotoolbox CMS data synchronization
Instant page loading with prefetching
Our carefully crafted methodology ensures that every component of our technology stack is perfectly aligned with your specific needs, business objectives, and operational requirements
We developed a sophisticated, interactive dashboard to visualize violence statistics in Thailand, enabling researchers and the public to explore and analyze complex data through an intuitive interface.
Our team created a comprehensive violence data visualization platform for UNDP and Chulalongkorn University's research project. The system efficiently handles complex data from Kobotoolbox CMS, provides real-time insights through interactive charts, maps, and timelines, and offers a user-friendly interface for in-depth analysis of violence statistics across Thailand.
Services & deliverables
Frontend development
Server-side logic implementation
User experience and interface design
Seamless information flow solutions
Scalable IT infrastructure solutions
Efficient project delivery oversight
Efficient data transfer solutions
Modular application architecture
At Tillitsdone, we're all about helping businesses like yours succeed in the digital world. We offer a wide range of services, from building websites to creating custom apps. Whatever your tech needs, we've got the skills to make it happen. Take a look at what we can do for you - we might just have the perfect solution to take your business to the next level.
Tillitsdone provides a comprehensive suite of services designed to address the multifaceted requirements of our diverse clientele. Our extensive expertise across multiple domains enables us to deliver bespoke solutions that catalyze success. We invite you to explore our service offerings and discover how we can propel your business towards prosperity.
Features
Interactive violence data visualization
Multi-attribute filtering system
Kobotoolbox CMS data synchronization
Instant page loading with prefetching
Multi-language support
Thailand map heat visualization
Interactive timeline section
Overview statistics with colorful graphs
Detailed event information popups
Raw data export functionality
Social media sharing integration
We understand that each business is unique. We work hand-in-hand with you to create solutions tailored to your specific goals, ensuring the final product aligns perfectly with your vision. We'll be right here with you every step of the way.
We ensure transparent communication, keeping you informed and engaged throughout the entire project. We'll be right here with you, maintaining open lines of dialogue at all times.
Insights at Your Fingertips
Illuminating Violence Patterns Through Interactive Data
The system dynamically visualizes violence data across multiple dimensions, allowing users to uncover patterns and trends through intuitive interactions and filters.
We developed a cutting-edge interactive dashboard for UNDP and Chulalongkorn University, designed to visualize and analyze violence statistics in Thailand. Our solution provides real-time data synchronization with Kobotoolbox, multi-attribute filtering, and optimized performance for seamless user experience.
1/9
Intuitive Hero Section
First Impressions Matter
A compelling and informative landing area that introduces users to the dashboard's purpose and capabilities.
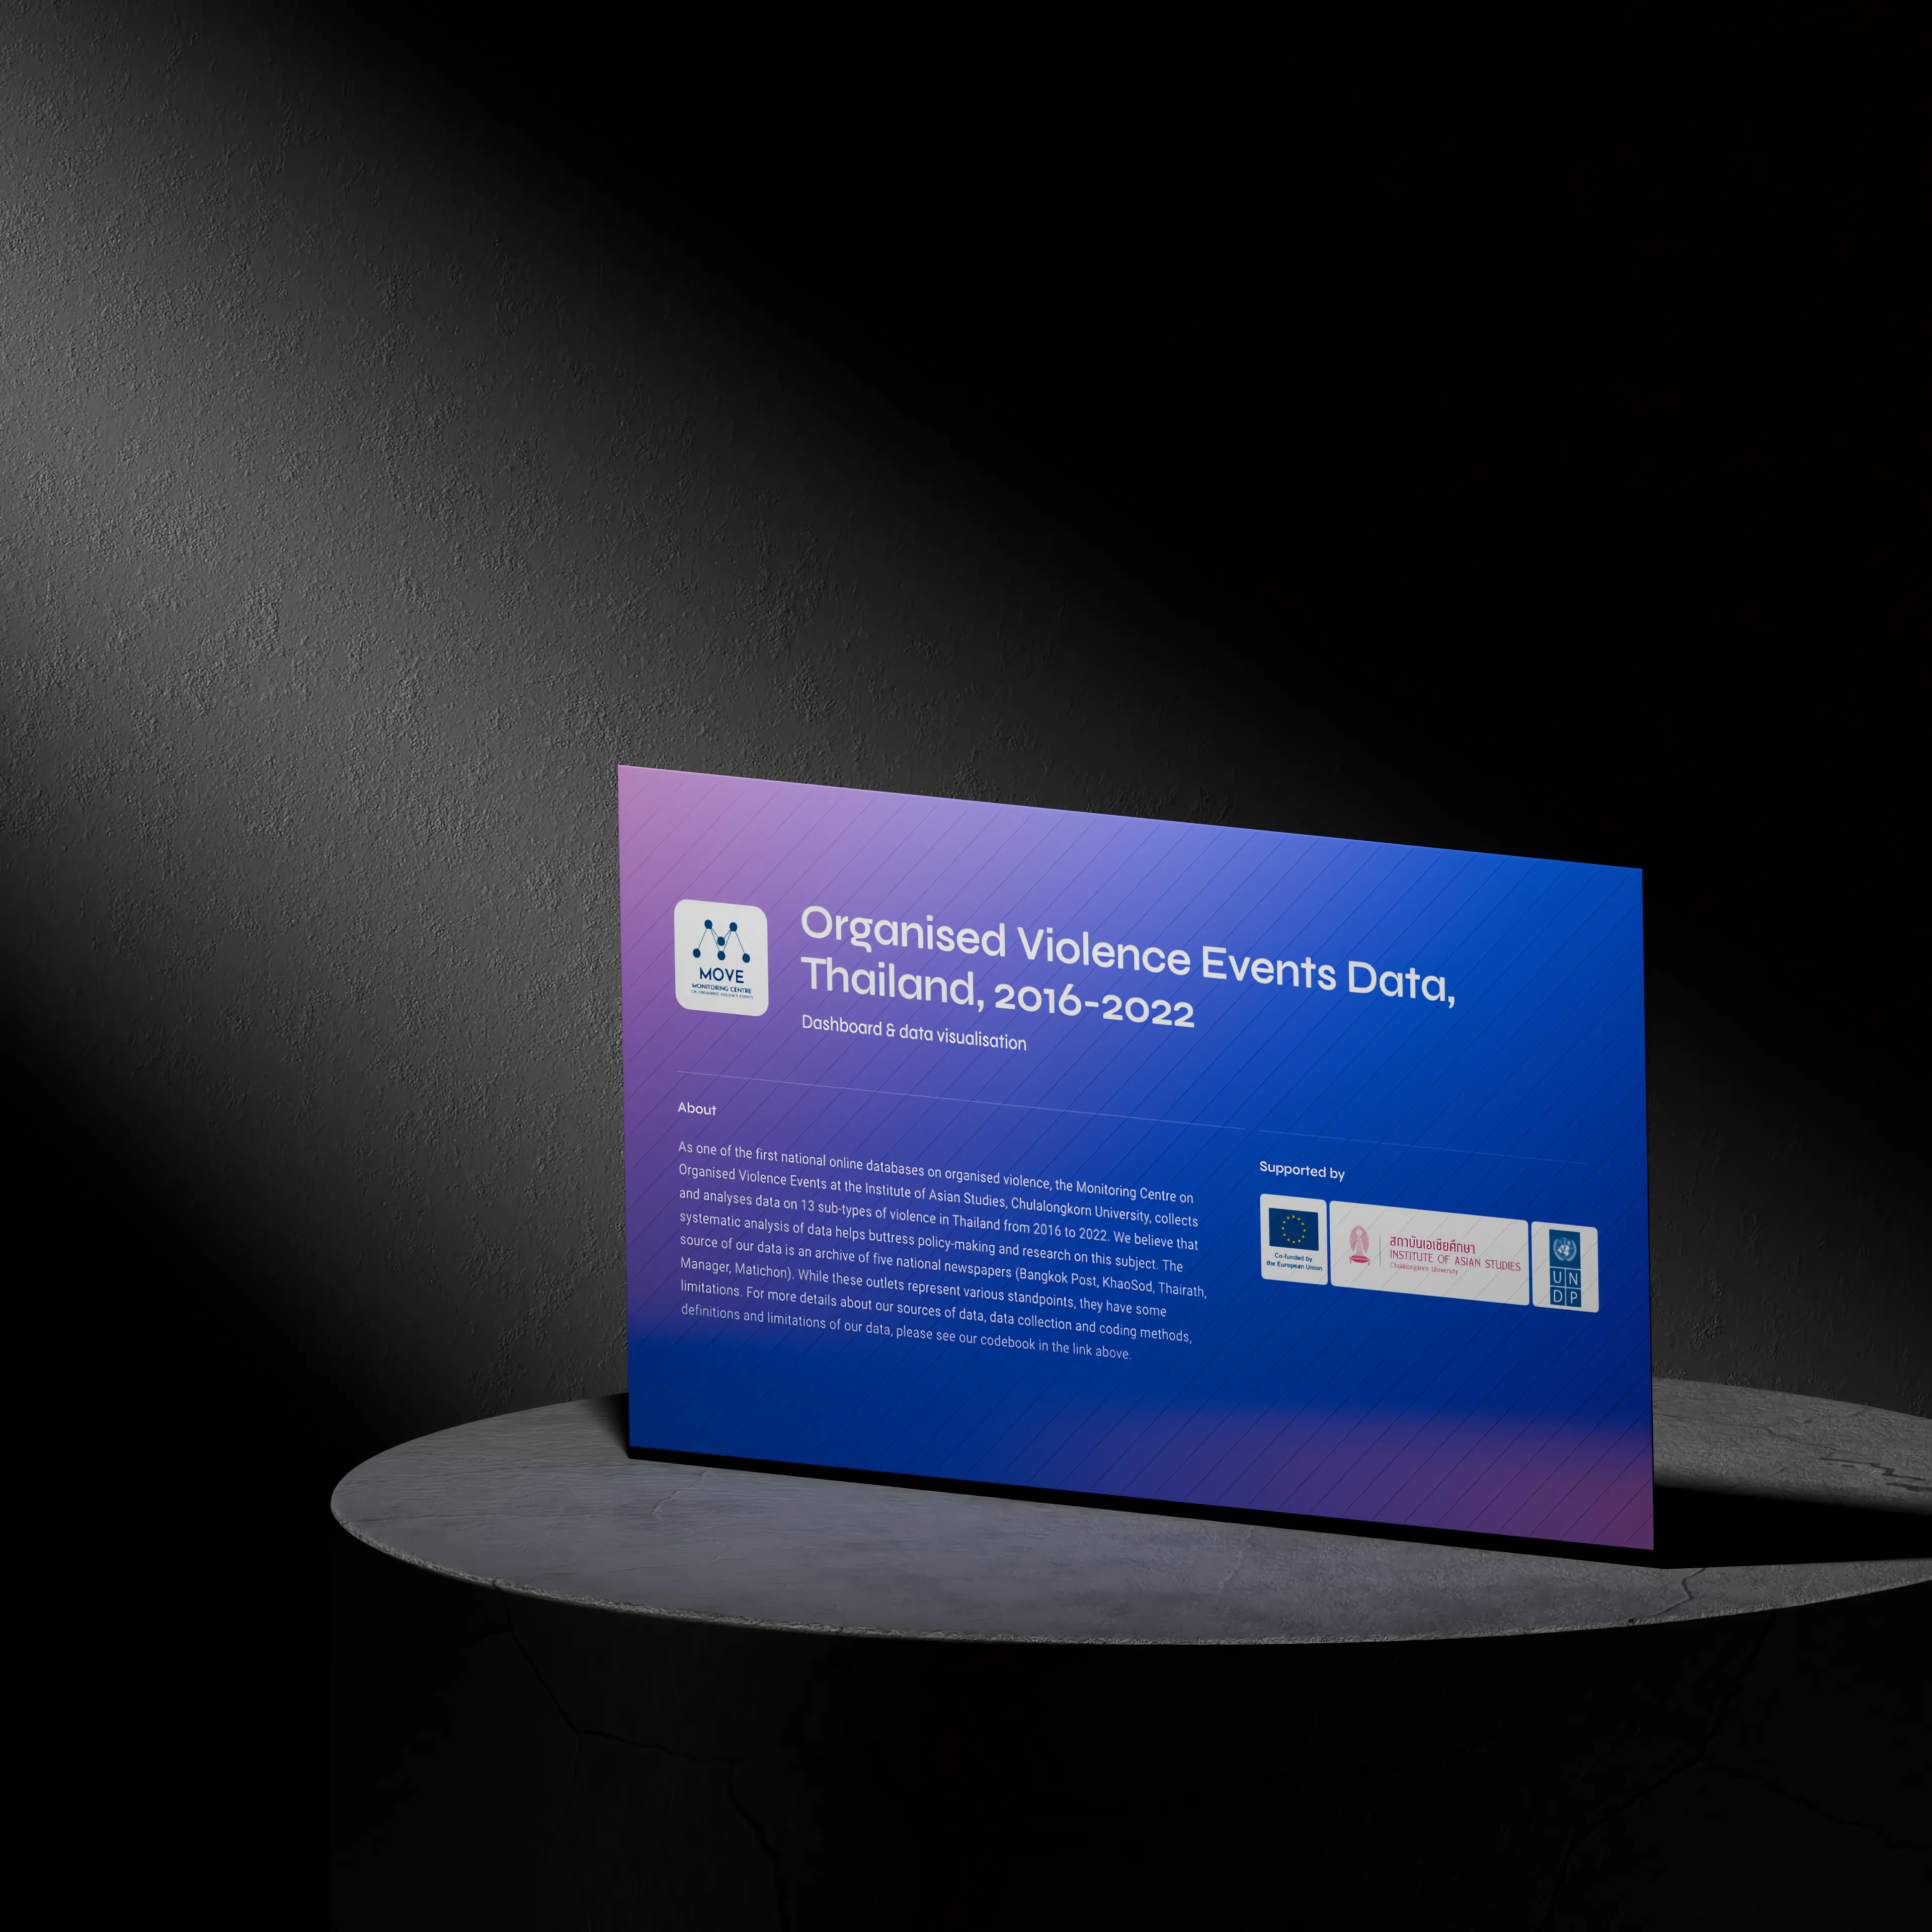
Dynamic Title and Description
Clear, concise title and description that immediately convey the dashboard's purpose and value to users.
Prominent Logo Display
Visual branding that reinforces the dashboard's identity and association with UNDP and Chulalongkorn University.
Language Selector
Easy-to-use language toggle allowing users to switch between multiple supported languages for enhanced accessibility.
Responsive Design
Fluid layout that adapts seamlessly to various screen sizes and devices, ensuring a consistent user experience.
2/9
Advanced Filtering System
Precision in Data Exploration
A comprehensive set of filters enabling users to drill down into specific aspects of the violence data with ease and accuracy.
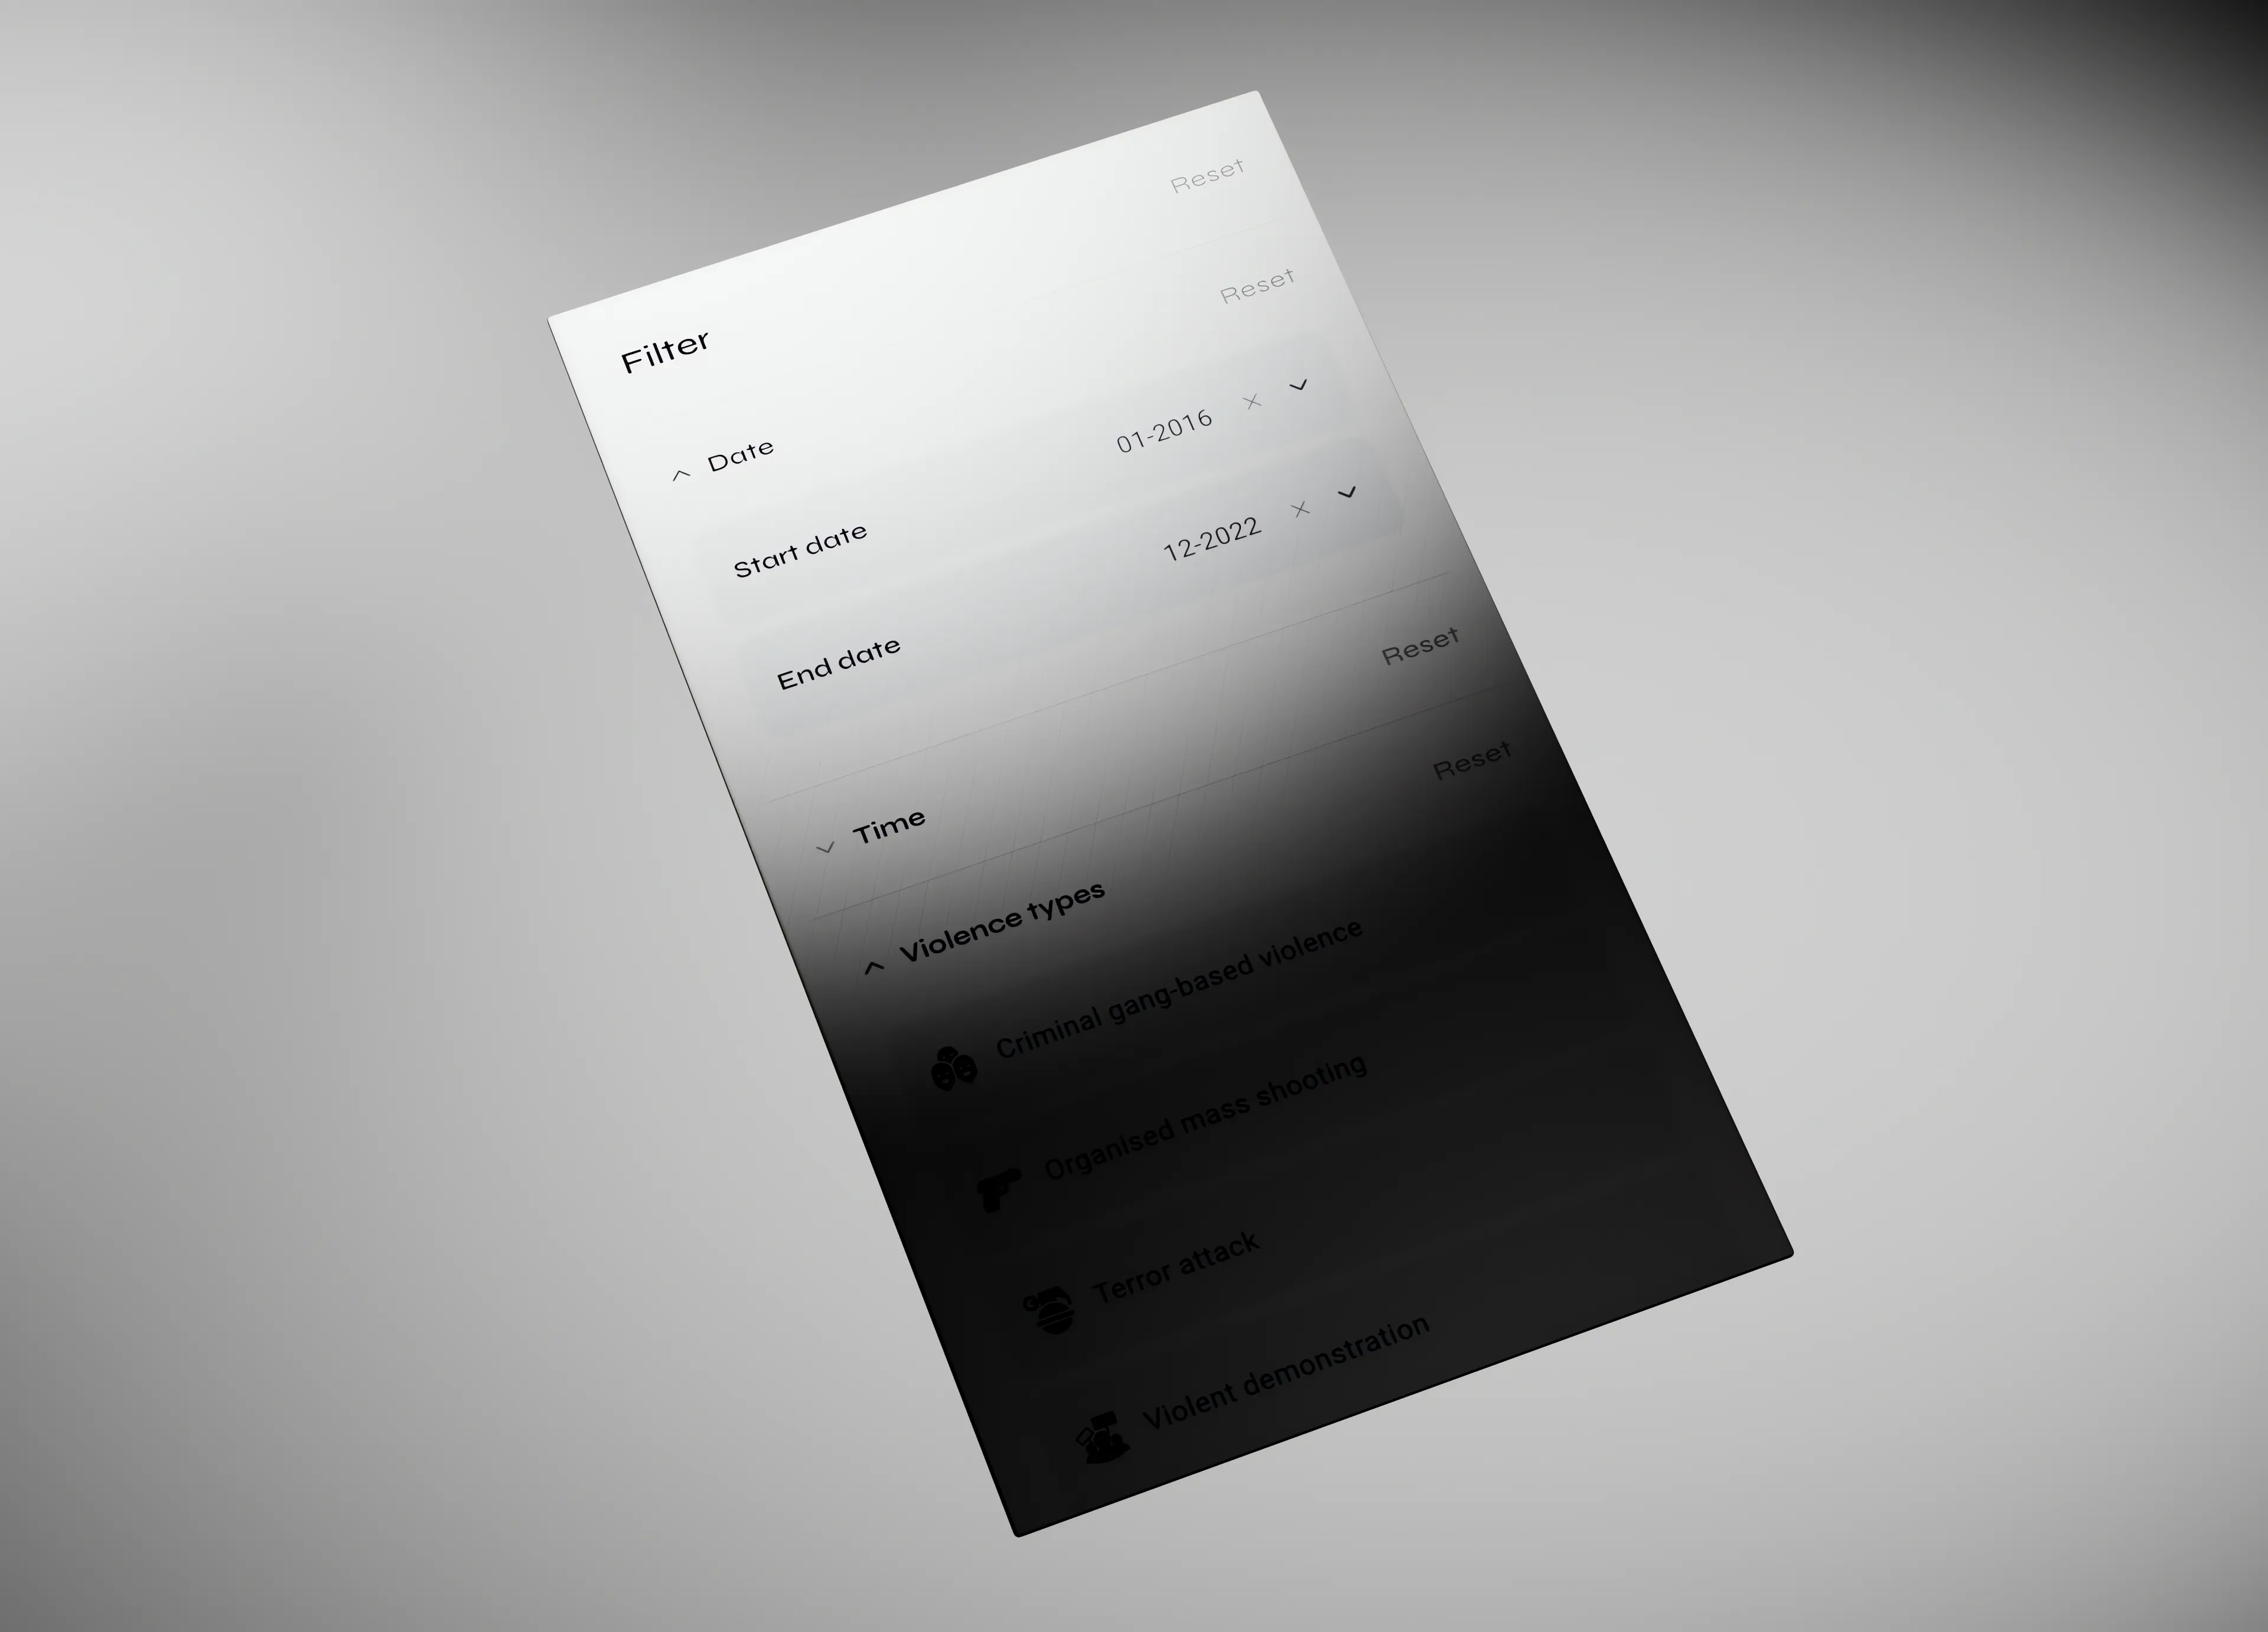
Multi-attribute Filtering
Intuitive interface for applying filters across multiple data dimensions, including date range, event type, location, and more.
Date Range Selection
Flexible date picker allowing users to specify custom start and end dates for focused temporal analysis.
Violence Type Categorization
Ability to filter data by specific categories of violence, enabling focused analysis on particular types of incidents.
Geographic Filtering
Options to filter data by province or specific locations, allowing for detailed regional analysis of violence patterns.
Real-time UI Updates
Instant recalculation and redrawing of visualizations as filters are applied or changed.
3/9
Comprehensive Overview Section
At-a-Glance Insights
A visually rich section providing key statistics and trends through interactive and colorful graphical representations.
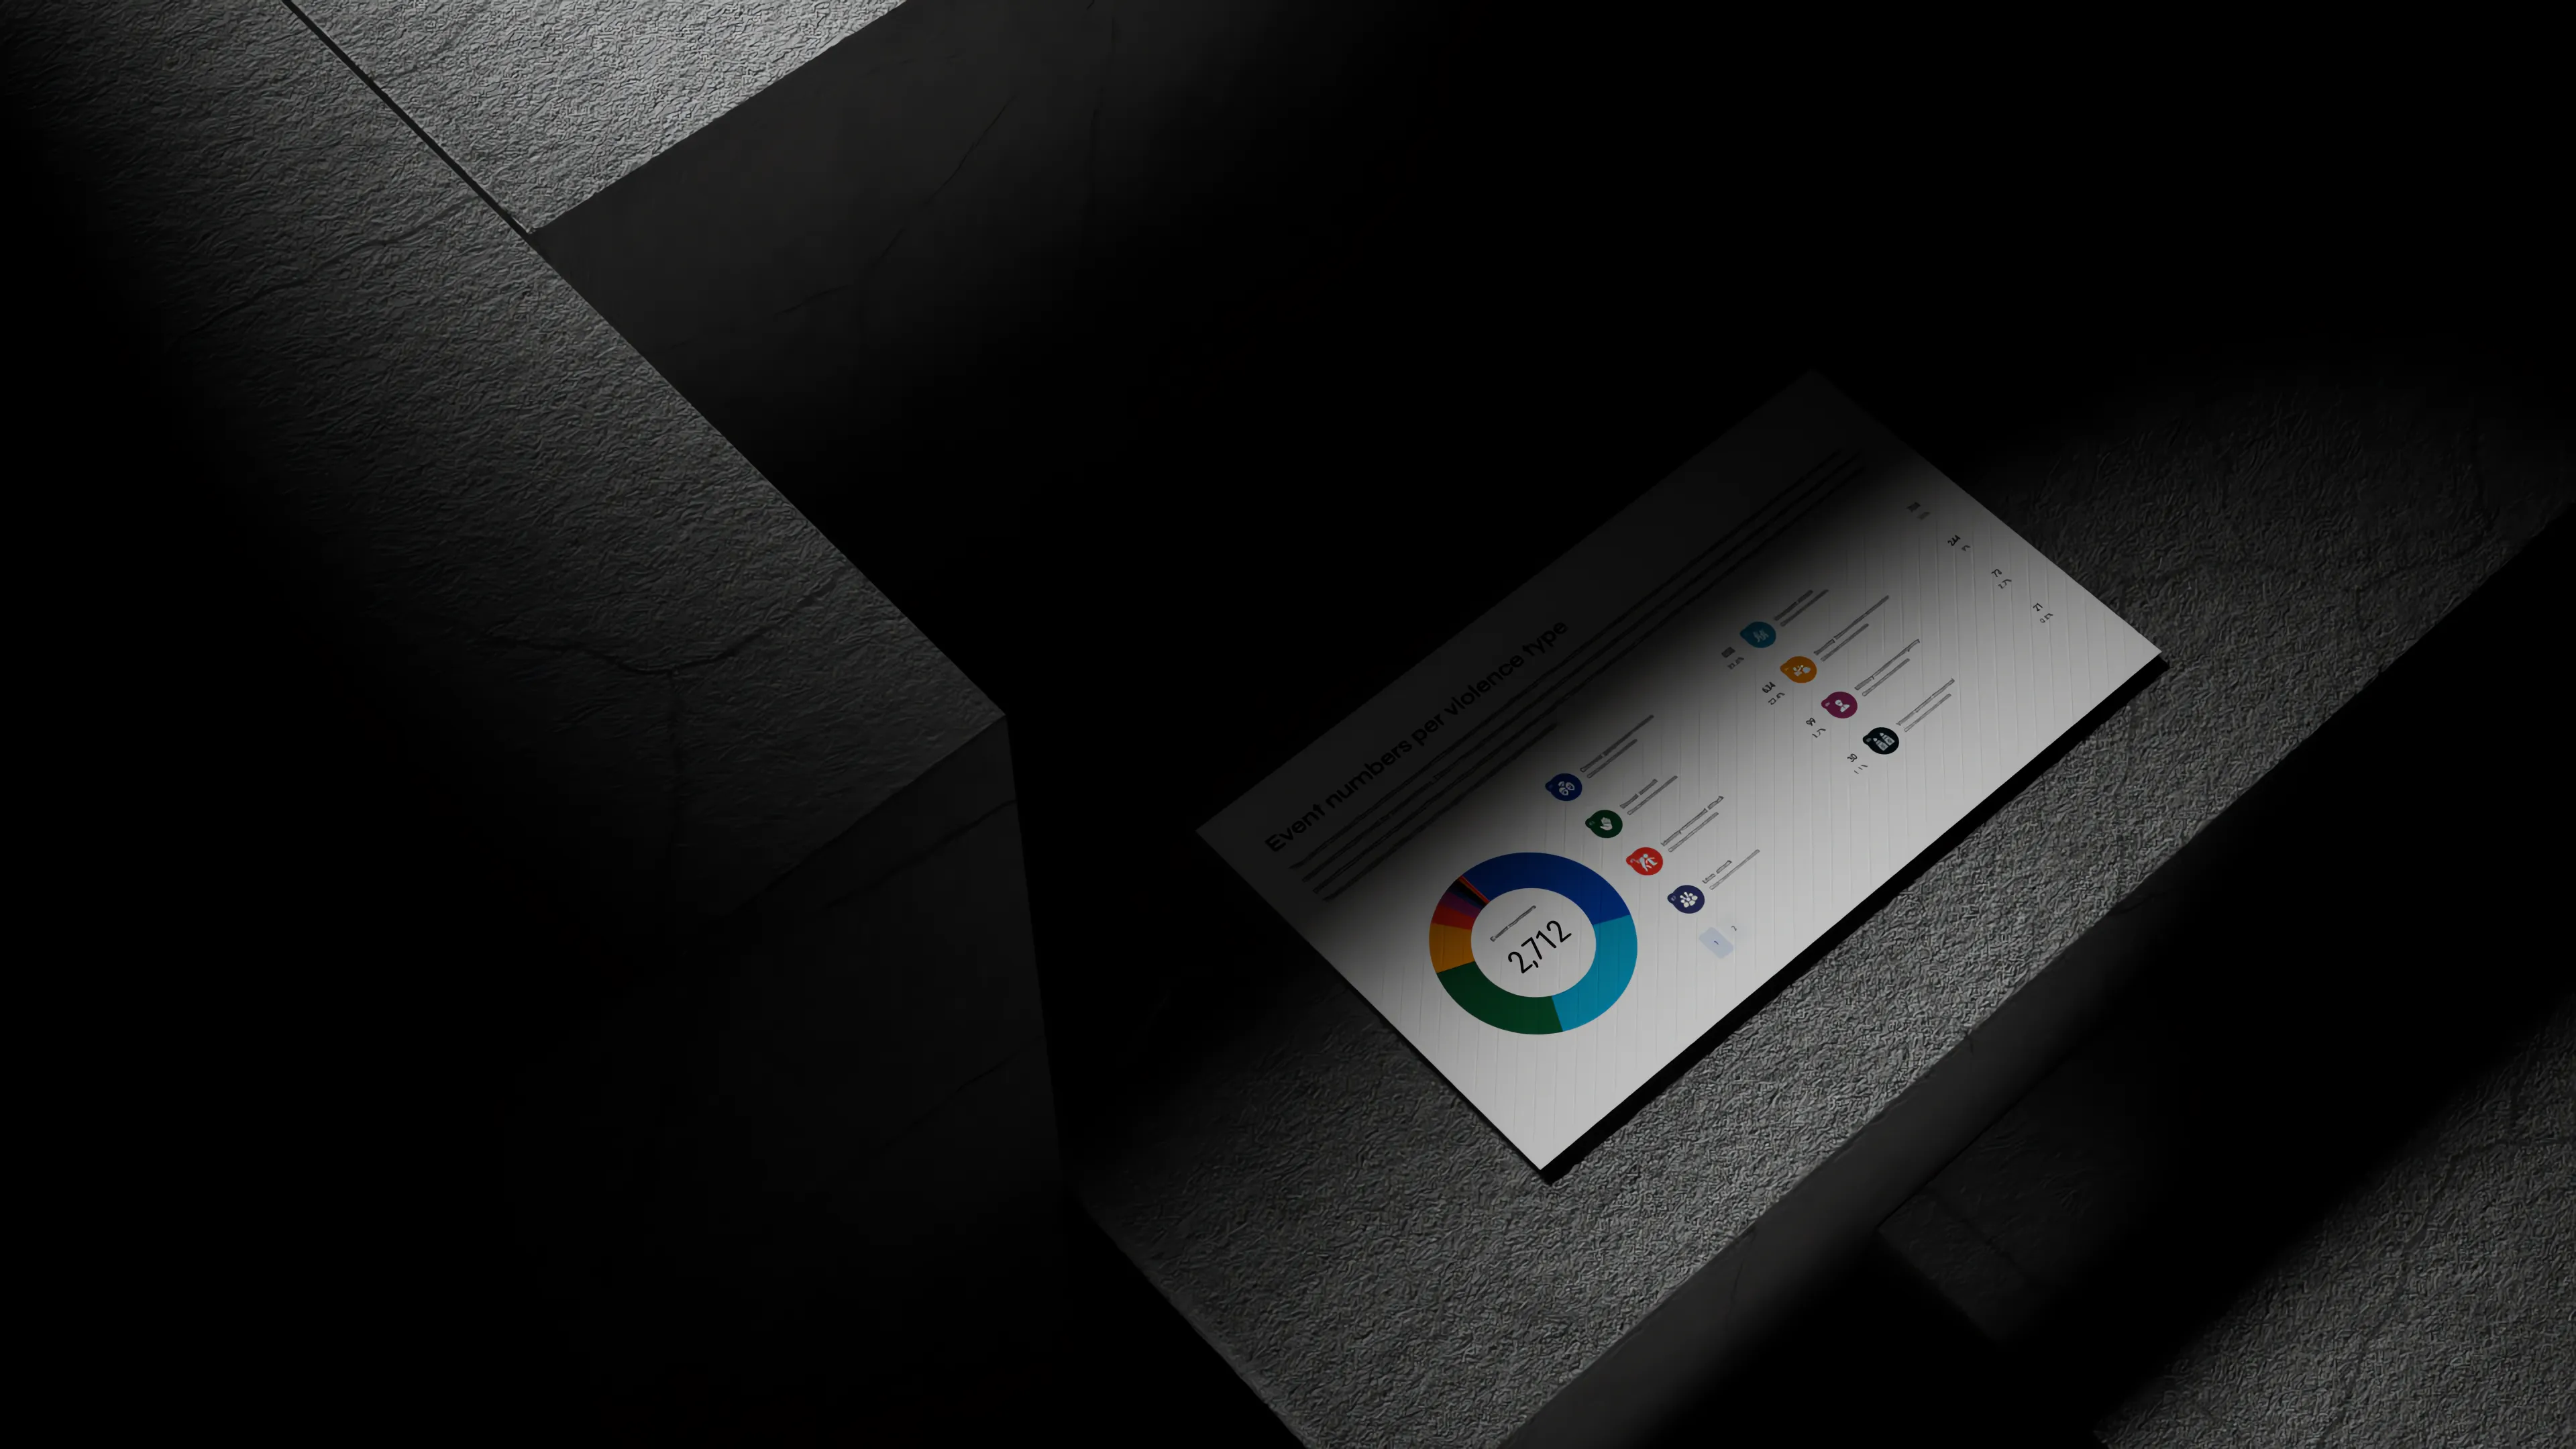
Colorful Statistical Graphs
Vibrant, easy-to-understand charts and graphs that display critical violence statistics and trends.
Violence Type Icons
Intuitive icons representing different categories of violence, enhancing visual comprehension of the data.
Event Number Analysis
Clear presentation of event numbers categorized by violence type, providing a quick understanding of prevalent issues.
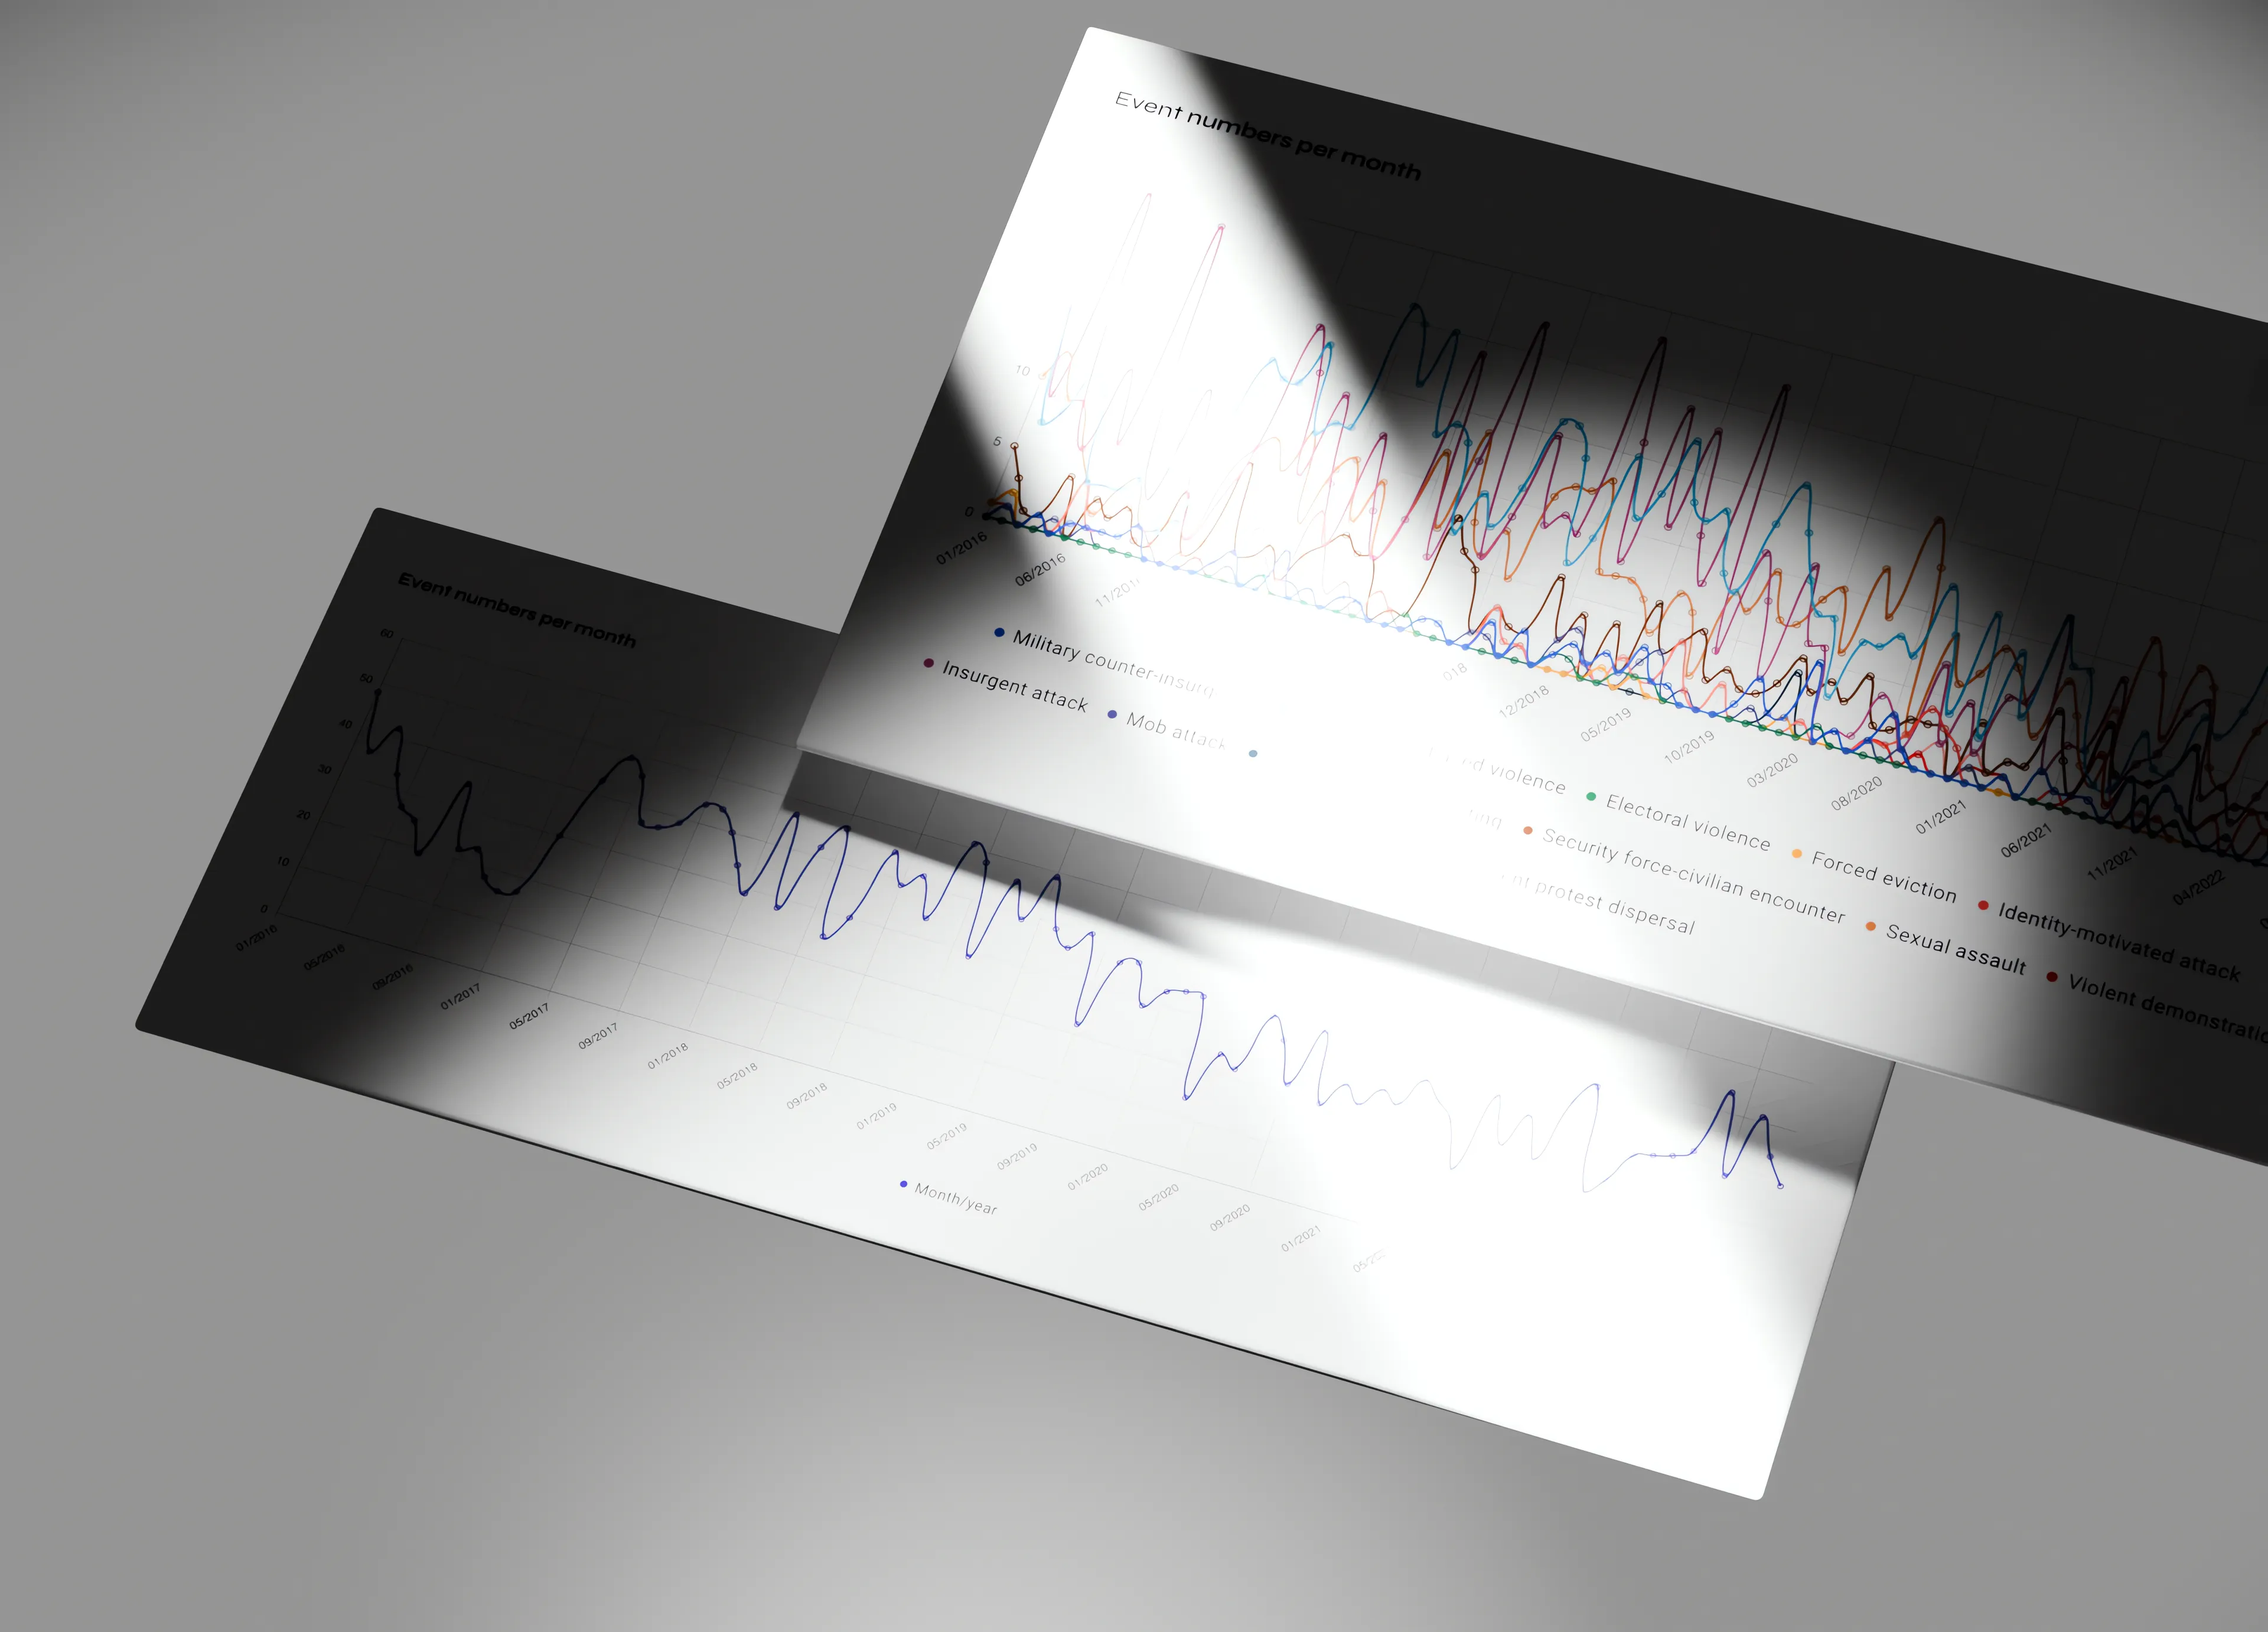
Temporal Trend Visualization
Dynamic graphs showing how event numbers change over time, revealing patterns and trends in violence occurrence.
4/9
Comprehensive Data Visualization
Bringing Statistics to Life
A robust set of visualization tools that transform raw violence data into meaningful, interactive infographics and charts.
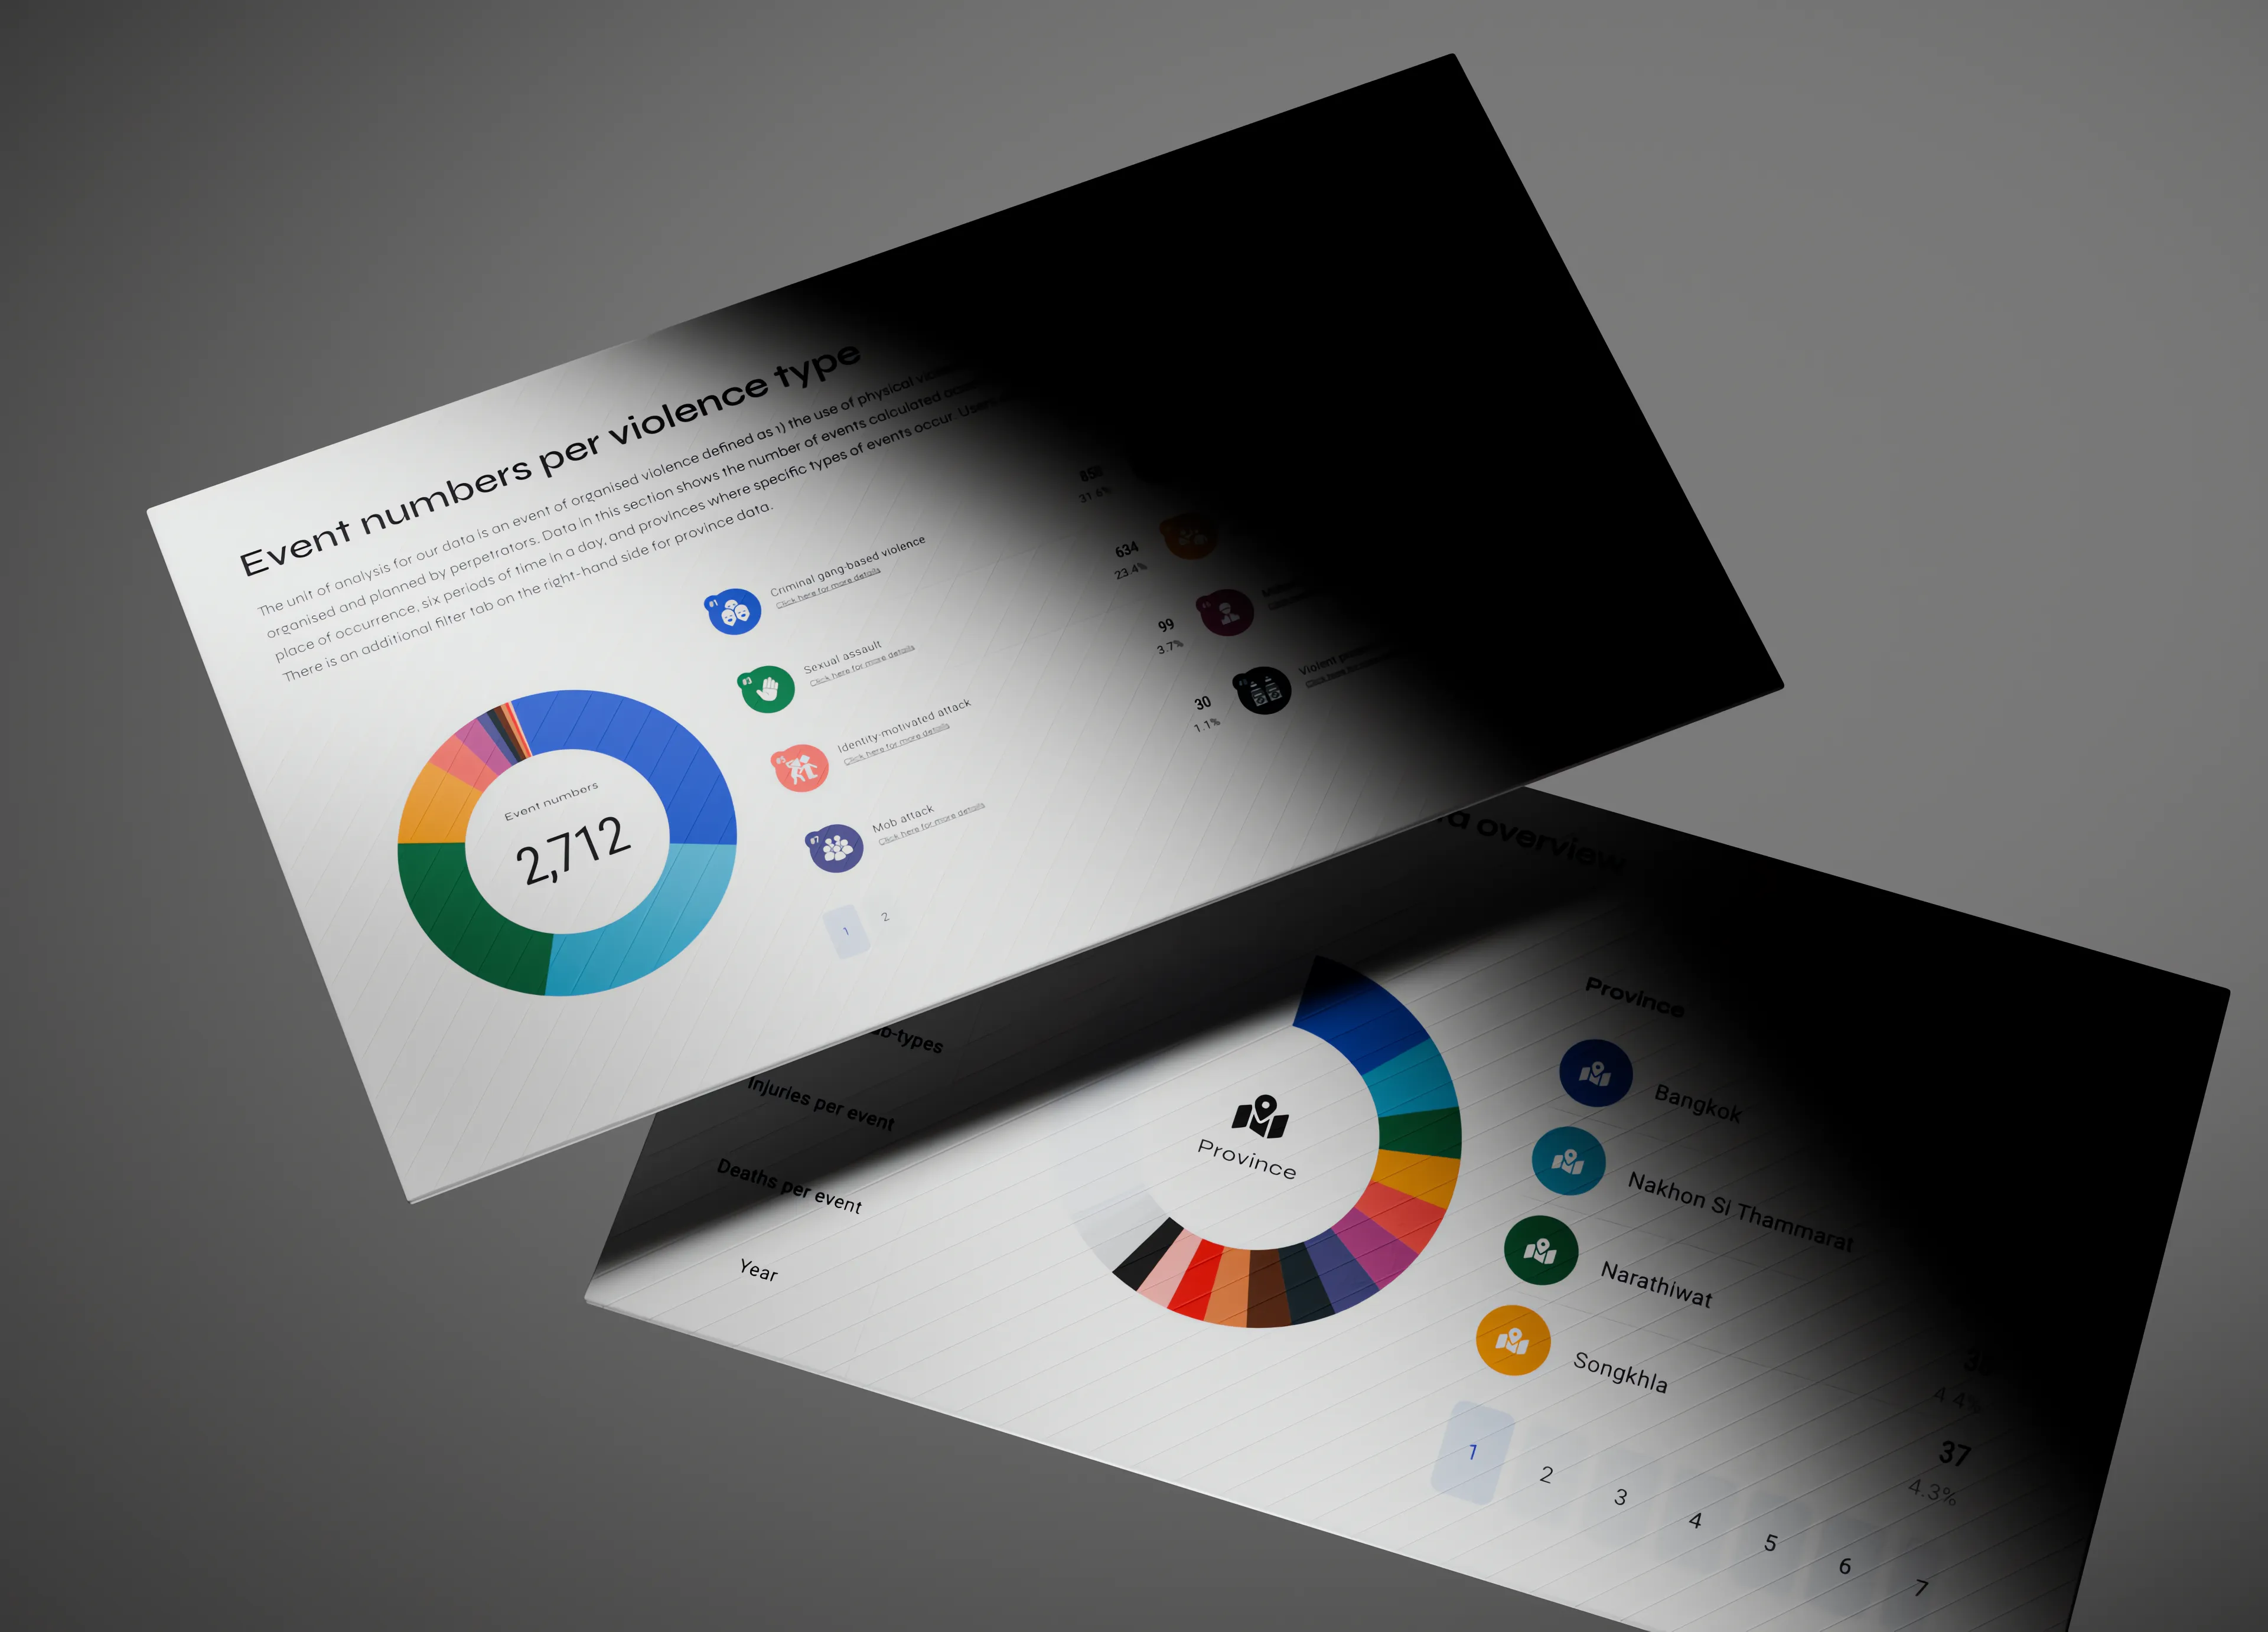
Interactive Overview Section
Colorful graphs displaying key statistics, including event numbers per violence type and temporal trends.
Event Popups
Clickable elements that reveal detailed information about specific events when interacted with.
Segmented Data Display
Ability to view and analyze subsets of data based on user-selected criteria or filters.
Comprehensive Event Details
Extensive information provided for each event, including date, location, type of violence, and other relevant metadata.
Context-Sensitive Information
Additional contextual details provided based on the type of event or data segment being examined.
Responsive Design
Fully responsive visualizations that adapt seamlessly to different screen sizes and devices.
5/9
Interactive Timeline Section
Tracking Trends Over Time
A dynamic timeline feature allowing users to visualize and interact with violence data across different time periods.
Colorful Timeline Graphs
Visually appealing graphs that display violence statistics over time, using color coding for clarity and impact.
Violence Type Toggle
Ability to switch between viewing all event types and focusing on specific categories of violence on the timeline.
Dynamic Filtering
Real-time updates to the timeline as users apply various filters, including date ranges and other criteria.
Responsive Timeline Design
Fully responsive timeline that adapts to different screen sizes while maintaining functionality and readability.
6/9
Thailand Map Visualization
Geospatial Insights at a Glance
An interactive heat map of Thailand providing a geographical representation of violence data across provinces.

Provincial Heat Map
Color-coded map of Thailand where red indicates provinces with the highest incidence of violence.
Customizable Sorting
Options for users to sort provinces by violence numbers or alphabetically by province name.
Data Type Selection
Ability to choose different types of data to display on the map, offering various perspectives on the violence data.
Filter-Responsive Map
Dynamic updating of the map based on applied filters, including date ranges and other selected criteria.
7/9
Optimized Data Management
Efficiency at the Core
Robust backend systems ensuring fast, reliable data handling and presentation.
Kobotoolbox Integration
Seamless synchronization with Kobotoolbox CMS, ensuring up-to-date violence data at all times.
Optimized Database Design
Carefully structured SQL database for efficient querying and rapid data retrieval.
Prefetching Technique
Implementation of prefetching for instant page loading, enhancing user experience.
Scalable Infrastructure
Backend and infrastructure design optimized for speed and performance under varying load conditions.
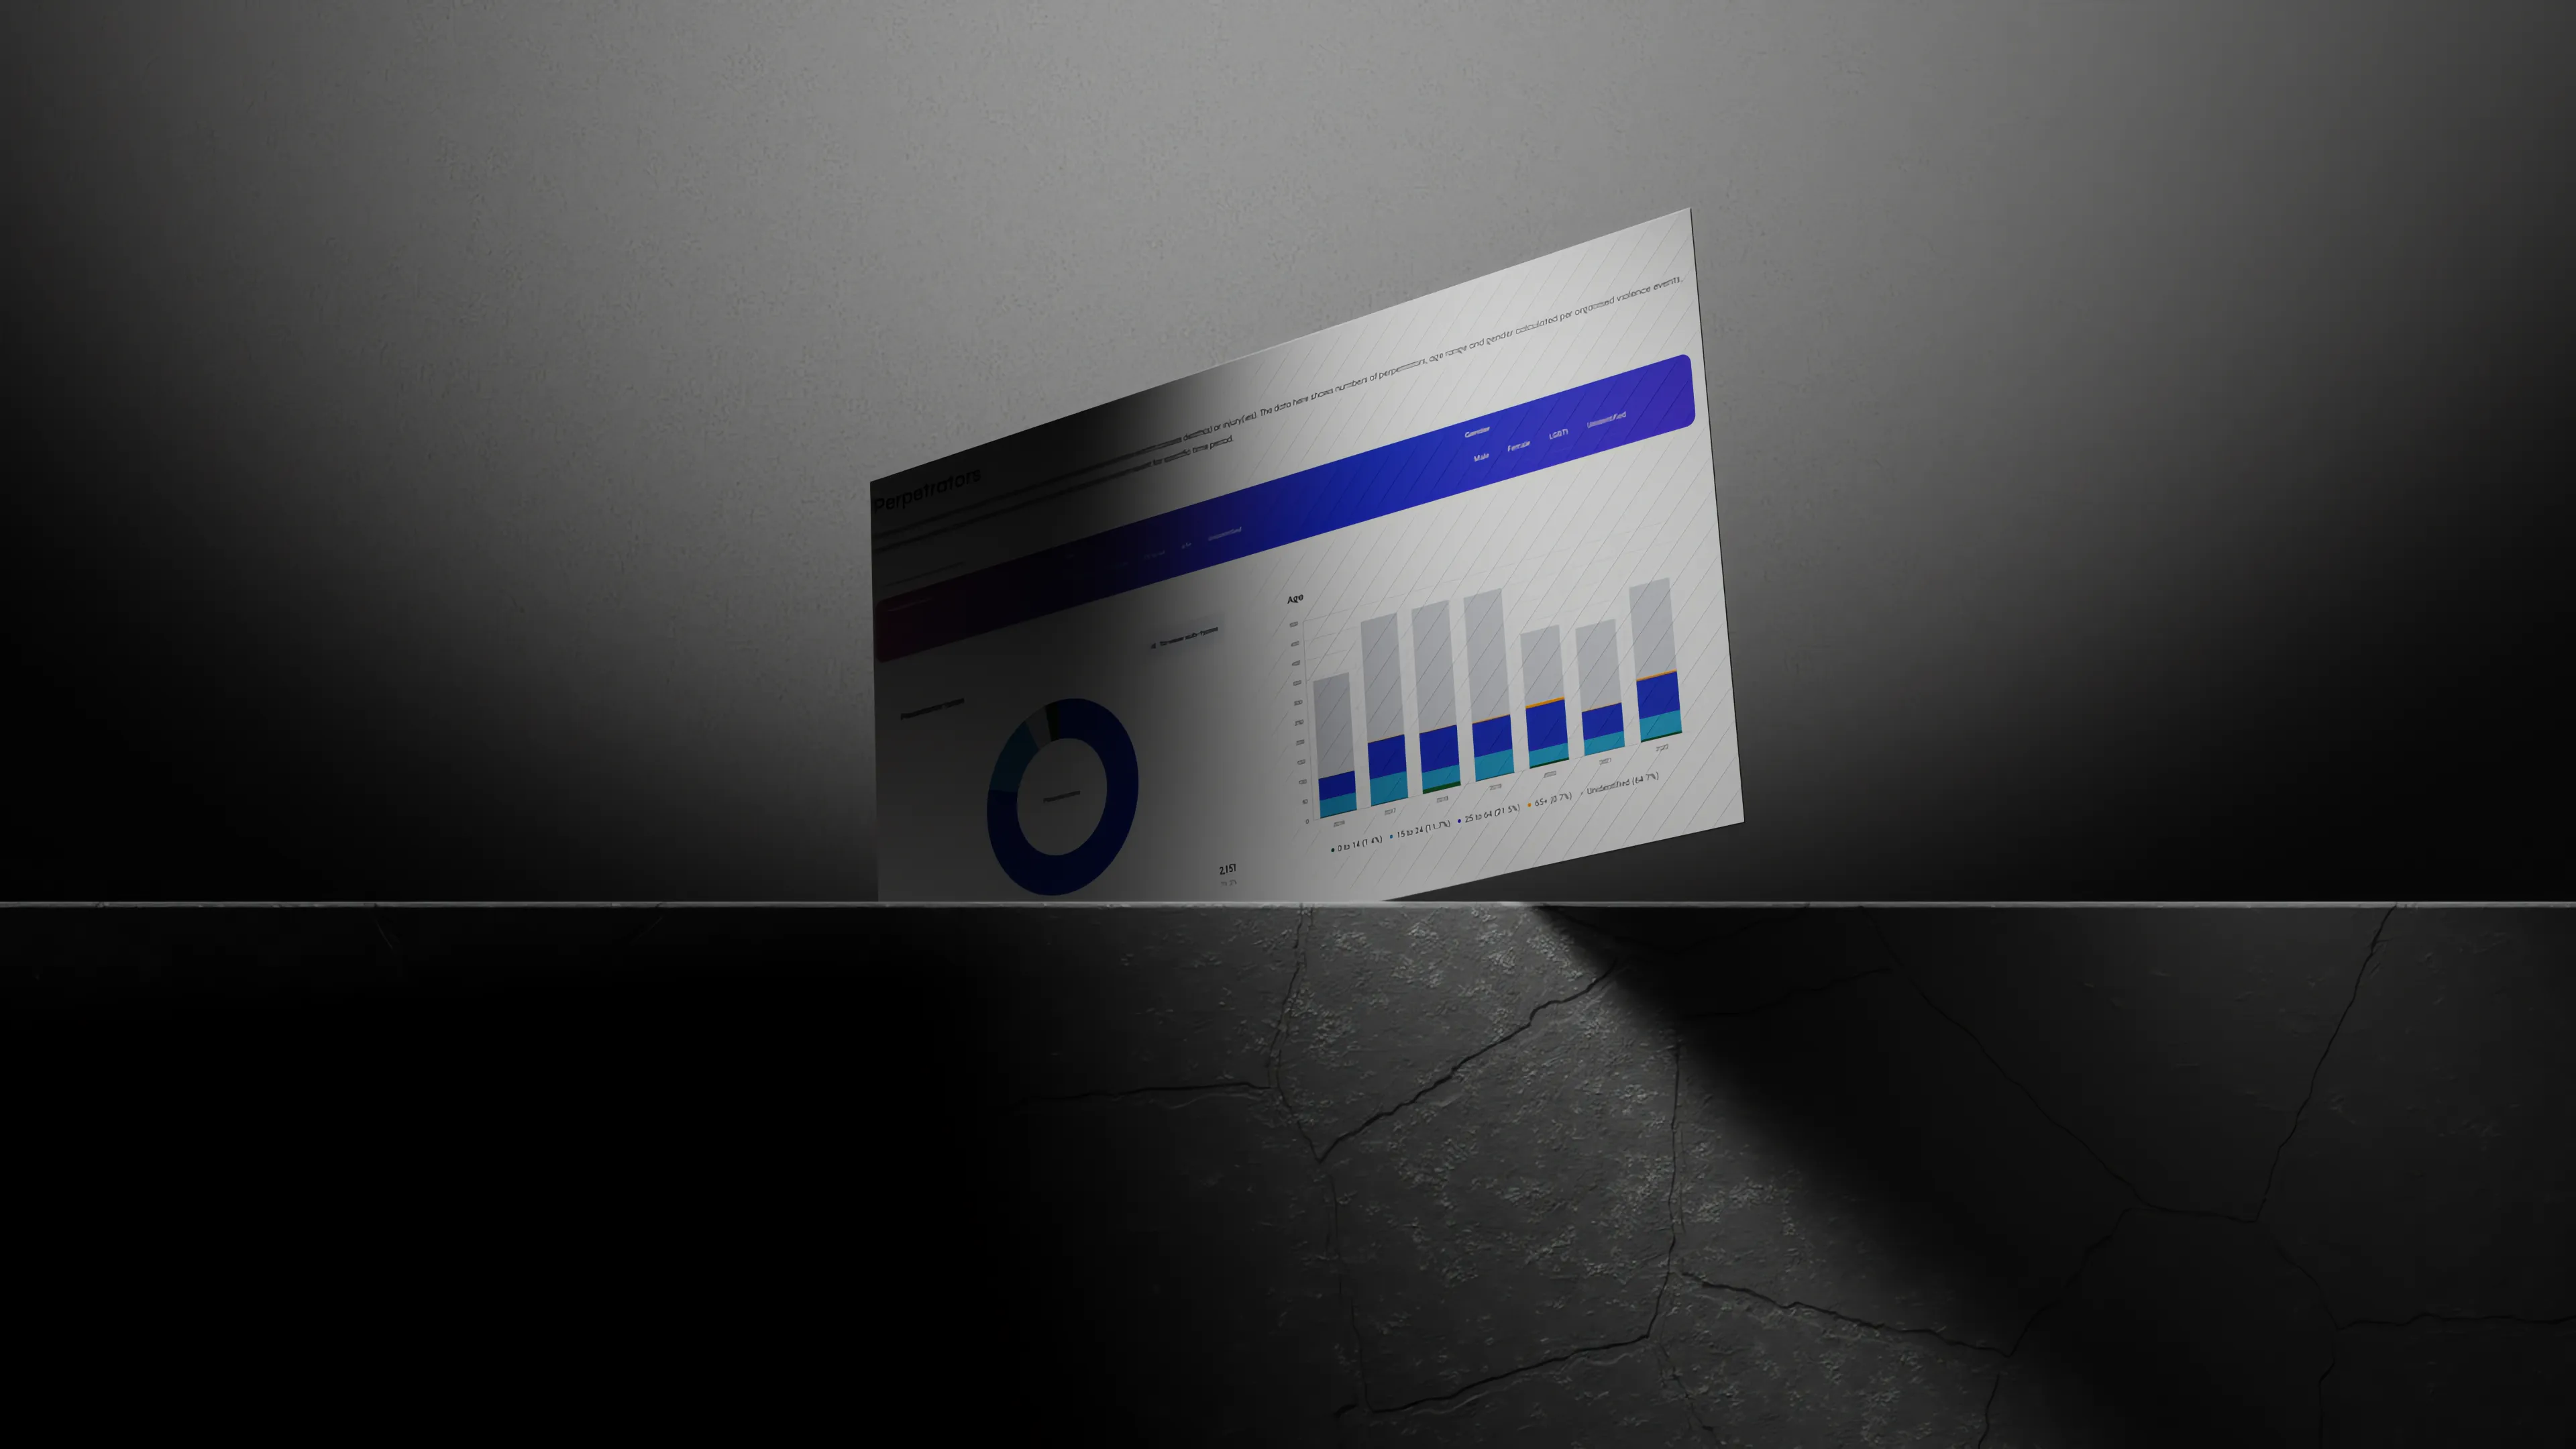
Perpetrator Data Analysis
Detailed breakdowns and statistics related to individuals or groups identified as perpetrators of violent acts.
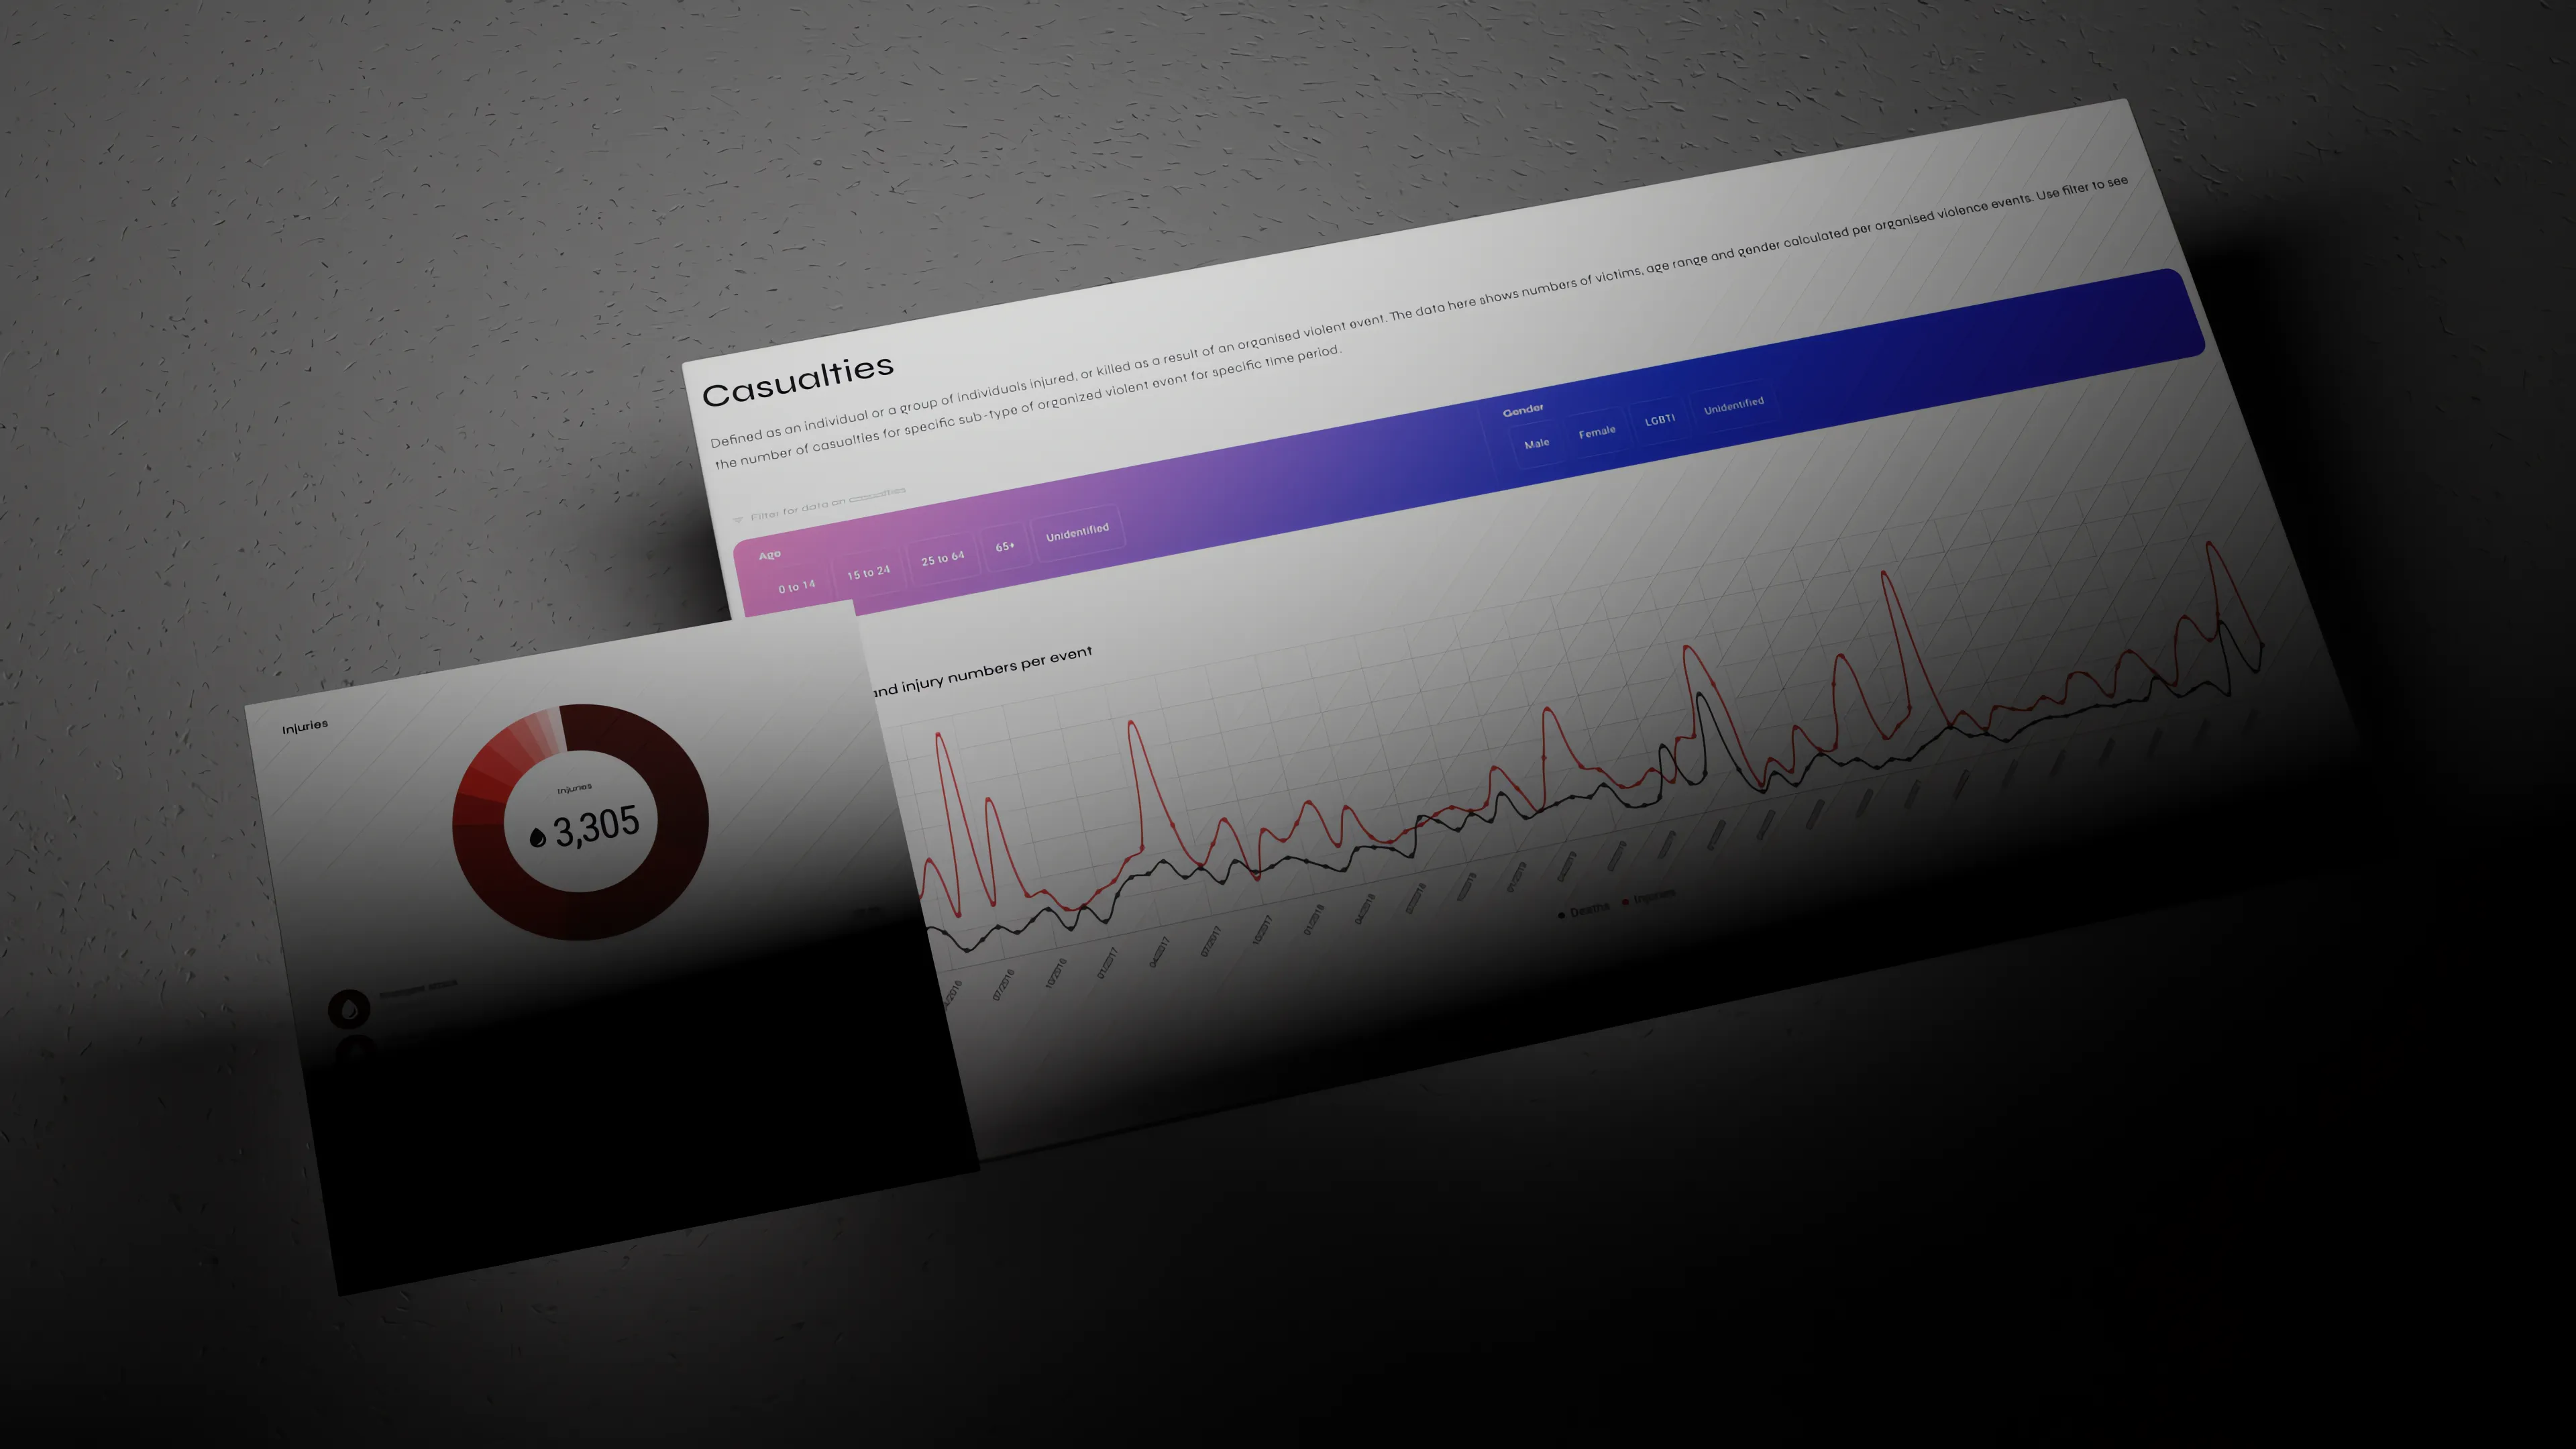
Casualty Data Insights
Comprehensive information and analysis regarding casualties resulting from violent incidents.
Trend Identification
Tools for identifying patterns and trends in perpetrator behavior and casualty demographics over time.
Comparative Analysis
Features allowing users to compare perpetrator and casualty data across different regions, time periods, or violence types.
8/9
Enhanced User Experience
Intuitive and Responsive
User-centric design features ensuring a smooth, engaging experience for all users.
Multilingual Support
Interface available in multiple languages to cater to a diverse user base.
Intuitive Navigation
Clear, user-friendly menu structure and interface design for easy exploration of the data.
Mobile Optimization
Fully responsive design ensuring a seamless experience across desktop, tablet, and mobile devices.
Interactive Elements
Engaging UI components like hover effects and clickable elements to enhance user interaction.
9/9
Data Accessibility and Sharing
Empowering Information Dissemination
Features designed to facilitate easy sharing and exporting of violence data and insights.
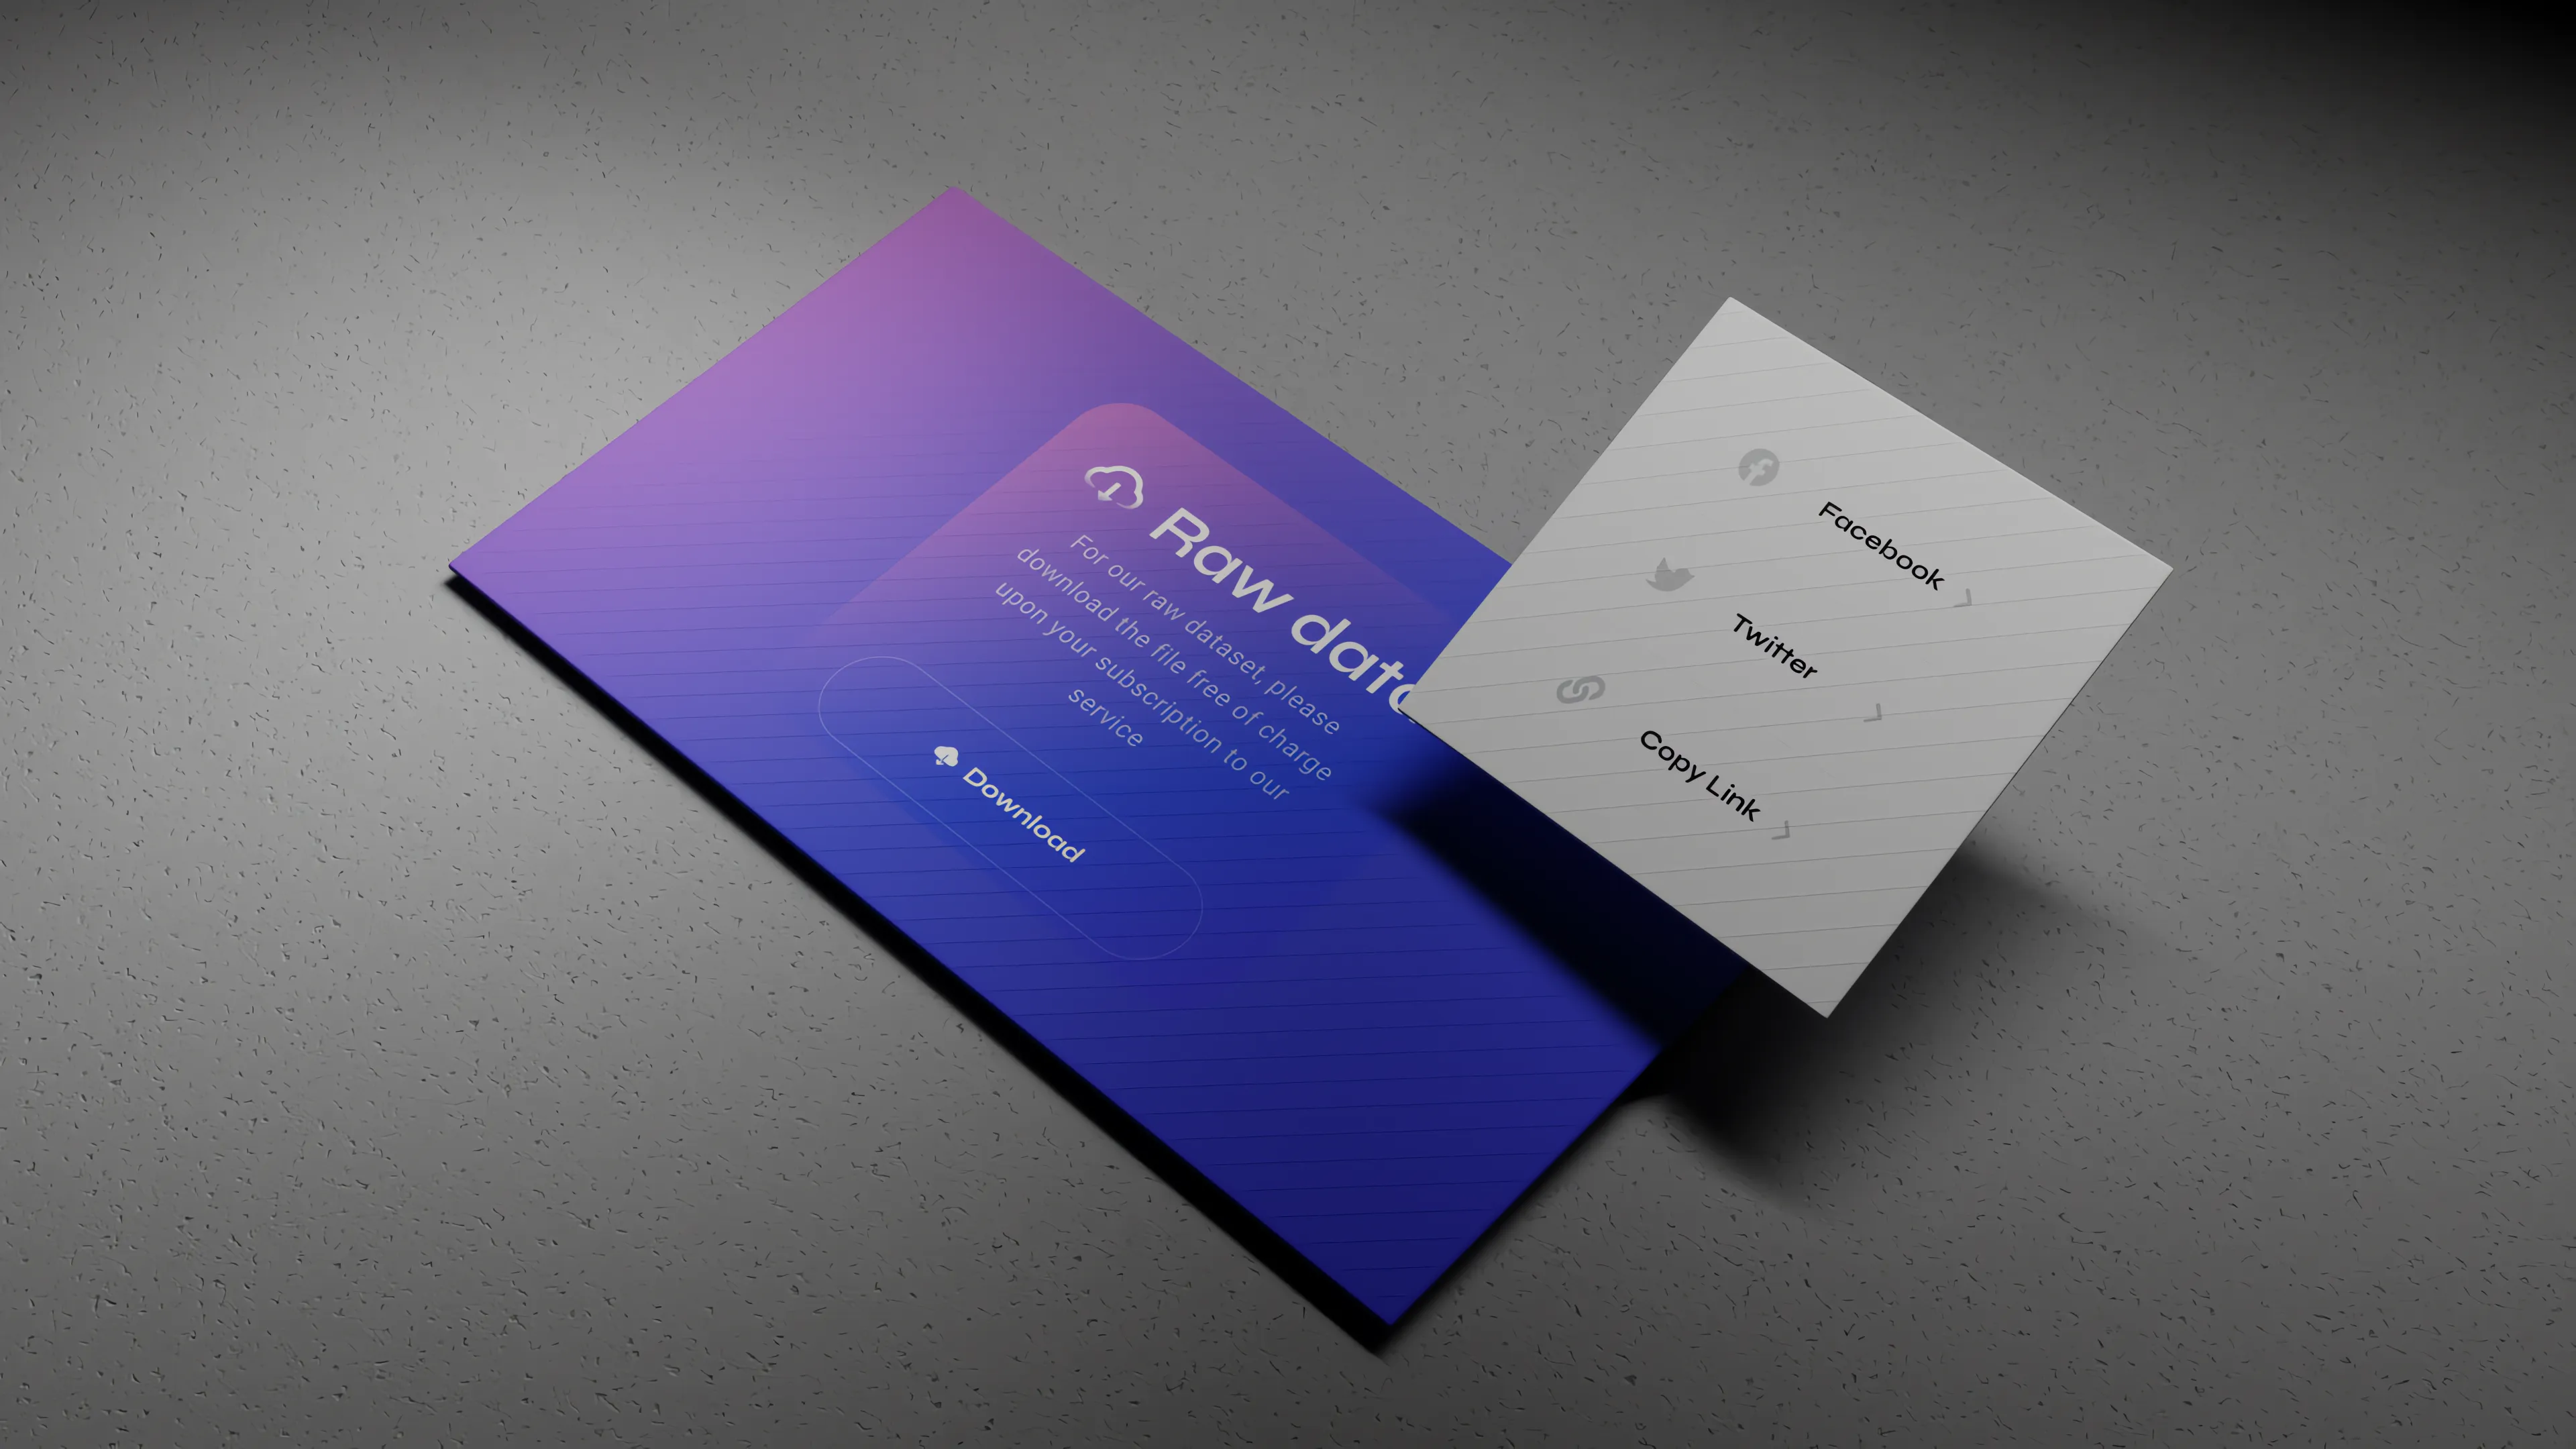
Raw Data Export
Functionality to export underlying data for further analysis or reporting.
Social Media Integration
Built-in options to share visualizations or insights directly to social media platforms.
Perpetrator and Casualty Data
Detailed information on perpetrators and casualties, accessible through the dashboard.
Customizable Views
Options for users to customize data views based on their specific research needs.
Movedata Dashboard Goals
Key objectives of the Movedata violence dashboard for UNDP and Chulalongkorn University
Interactive Data Visualization
Develop a system capable of dynamically visualizing violence statistics through interactive charts, maps, and timelines.
Efficient Data Management
Implement a robust data management system with seamless integration to Kobotoolbox CMS and optimized database design for rapid data retrieval.
Advanced Filtering and Analysis
Develop a comprehensive filtering system allowing users to explore data across multiple dimensions and gain deeper insights.
Optimized Performance
Engineer a high-performance system capable of handling large volumes of data and concurrent users while maintaining rapid response times.
Enhanced Accessibility and Sharing
Implement features to facilitate easy data export, sharing of insights, and multilingual support for broader accessibility.
Tech & Tools
Leveraging the latest technologies and frameworks, we build robust and scalable solutions that meet your unique business requirements.
Web Application Frontend
Our carefully selected frontend technology stack is designed to create highly responsive, intuitive, and engaging user interfaces.
These technologies work in harmony to enhance the overall user experience, ensuring smooth interactions and optimal performance across various devices and platforms.
These technologies work in harmony to enhance the overall user experience, ensuring smooth interactions and optimal performance across various devices and platforms.


Backend
Our backend technology stack is designed to handle server-side operations with efficiency, scalability, and security, ensuring reliable and high-performance solutions.

Cross Platform Application
Our cross-platform application development leverages advanced frameworks to deliver versatile mobile applications that maintain consistent performance and user experience across various platforms.
By utilizing these frameworks, we ensure that applications are highly performant, visually appealing, and reliable, regardless of the platform on which they are deployed.
By utilizing these frameworks, we ensure that applications are highly performant, visually appealing, and reliable, regardless of the platform on which they are deployed.


Cloud Providers
We leverage leading cloud platforms to deploy, manage, and scale applications effectively.
By utilizing these cloud services, we ensure that our applications perform optimally, are highly available, and can scale according to demand.
Our approach involves integrating various cloud tools and services to enhance performance, reliability, and overall efficiency in managing and operating applications.


Integrations
Our integration capabilities enable seamless connectivity with a variety of external services and platforms, enhancing the functionality and user experience of our applications.
By leveraging these integrations, we provide users with enhanced features and streamlined workflows that connect applications with widely-used tools and services.
By leveraging these integrations, we provide users with enhanced features and streamlined workflows that connect applications with widely-used tools and services.


Design Tools
We use a range of design tools to create applications that are both functional and aesthetically pleasing.
From collaborative design platforms and digital whiteboards to powerful image editing and 3D creation tools, our design process ensures that every aspect of the user experience is carefully crafted and visually engaging.
From collaborative design platforms and digital whiteboards to powerful image editing and 3D creation tools, our design process ensures that every aspect of the user experience is carefully crafted and visually engaging.


196 Articles
Explore Popular JavaScript library for building user interfaces with a component-based architecture.
160 Articles
Explore  Flutter
 UI toolkit for building natively compiled applications for mobile, web, and desktop from a single codebase.
144 Articles
Explore JavaScript runtime for building scalable, high-performance server-side applications.
58 Articles
Explore  Nextjs
 React framework enabling server-side rendering and static site generation for optimized performance.
38 Articles
Explore  TailwindCSS
 Utility-first CSS framework for rapid UI development.
36 Articles
Explore  Typescript
 Superset of JavaScript adding static types for improved code quality and maintainability.
126 Articles
Explore Golang Programming language known for its simplicity, concurrency model, and performance.
67 Articles
Explore AstroJs Astro is an all-in-one web framework. It includes everything you need to create a website, built-in.
38 Articles
Explore Jest Versatile testing framework for JavaScript applications supporting various test types.
16 Articles
Explore Website development th 11 Articles
Explore Mobile application th 5 Articles
Explore Reactjs th 4 Articles
Explore Nextjs th 3 Articles
Explore Flutter th 1 Articles
Explore Software house th 1 Articles
Explore Nodejs th 1 Articles
Explore Typescript th 337 Articles
Explore  CSS
CSS CSS3 is the latest version of Cascading Style Sheets, offering advanced styling features like animations, transitions, shadows, gradients, and responsive design.
Let's keep in Touch
Thank you for your interest in Tillitsdone! Whether you have a question about our services, want to discuss a potential project, or simply want to say hello, we're here and ready to assist you.
We'll be right here with you every step of the way.
We'll be right here with you every step of the way.
Contact Information
rick@tillitsdone.com+66824564755
Address
9 Phahonyothin Rd, Khlong Nueng, Khlong Luang District, Pathum Thani, Bangkok Thailand
Social media
FacebookInstagramLinkedIn
We anticipate your communication and look forward to discussing how we can contribute to your business's success.
We'll be here, prepared to commence this promising collaboration.
We'll be here, prepared to commence this promising collaboration.


Frequently Asked Questions
Explore frequently asked questions about our products and services.
Whether you're curious about features, warranties, or shopping policies, we provide comprehensive answers to assist you.
Whether you're curious about features, warranties, or shopping policies, we provide comprehensive answers to assist you.